Interpretation of DHI Characteristics with Machine Learning

By Rocky Roden and ChingWen Chen, Ph.D. | Published with permission: First Break | May 2017

Introduction

In conventional geological settings, oil companies routinely evaluate prospects for their drilling portfolio where the process of interpreting seismic amplitude anomalies as Direct Hydrocarbon Indicators (DHIs) plays an important role. DHIs are an acoustic response owing to the presence of hydrocarbons and can have
a significant impact on prospect risking and determining well locations (Roden et al., 2005; Fahmy 2006; Forrest et al., 2010; Roden et al., 2012; Rudolph and Goulding, 2017). DHI anomalies are caused by changes in rock physics properties (P and S wave velocities, and density) typically of the hydrocarbon-filled
reservoir in relation to the encasing rock or the brine portion of the reservoir. Examples of DHIs include bright spots, flat spots, character/phase change at a projected oil or gas/water contact, amplitude conformance to structure, and an appropriate amplitude variation with offset on gathers. Many uncertainties should be considered and analyzed in the process of assigning a probability of success and resource estimate range before including a seismic amplitude anomaly prospect in an oil company’s prospect portfolio (Roden et al., 2012).

Seismic amplitude anomalies that are DHIs have played a major role in oil and gas exploration since the early 1970s (Hilterman, 2001). The technology and methods to identify and risk seismic amplitude anomalies have advanced considerably over the years, especially with the use of AVO (Amplitude vs. Offset) and improved acquisition and processing seismic technology (Roden et al., 2014). The proper evaluation of seismic direct hydrocarbon indicators for appropriate geologic settings has proven to have a significant impact on risking prospects. Rudolph and Goulding (2017) indicate from an ExxonMobil database of prospects that DHI-based prospects had over twice the success rate of non-DHI prospects on both a geologic and economic basis. In an industry-wide database of DHI prospects from around the world, Roden et al. (2012) indicate that when a prospect has a >20% DHI Index, a measure of the risk associated with DHI characteristics, almost all the wells were successful. Even with the use of advanced seismic technology and well-equipped interpretation workstations, the interpretation of DHI characteristics is not always easy or straightforward.

A key technology employed in evaluating potential DHI features is seismic attributes. Seismic attributes are any measurable property of seismic data including stacked or prestack data. Seismic attributes can be computed on a trace, multiple traces, on an entire volume, over isolated windows, on a horizon, and in either
time or depth. There are hundreds of seismic attributes generated in our industry (Brown, 2004; Chen and Sidney, 1997; Chopra and Marfurt, 2007; Taner, 2003) and can be generally categorized as instantaneous, geometric, AVO, seismic inversion, and spectral decomposition attributes. The instantaneous, AVO, and inversion attributes are typically utilized to highlight and identify DHI features. For example, amplitude envelope, average energy, and sweetness are good instantaneous attributes to display how amplitudes stand out above the background, potentially identifying a bright spot and a potential hydrocarbon accumulation. AVO attributes such as intercept times gradient, fluid factor, Lambda/Mu/Rho and far offset-minus near offset-times the far offset can help to identify hydrocarbon-bearing reservoirs (Roden et al., 2014). However, not all amplitude anomalies are DHIs and interpreting numerous seismic attributes can be complicated and at times confusing. In addition, it is almost impossible for geoscientists to understand how numerous seismic attributes (>3) interrelate.

Over the last few years, machine learning has evolved to help interpreters handle numerous and large volumes of data (e.g. seismic attributes) and help to understand how these different types of data relate to each other. Machine learning uses computer algorithms that iteratively learn from the data and independently adapt to produce reliable, repeatable results. We incorporate a machine learning workflow where principal component analysis (PCA) and self-organizing maps (SOM) are employed to analyze combinations of seismic attributes for meaningful patterns that correspond to direct hydrocarbon indicators. A machine learning multi-attribute approach with the proper input parameters can help interpreters to more efficiently and accurately evaluate DHIs and help reduce risk in prospects and projects.

Interpreting DHIs
Table 1. Most important DHI characteristics for AVO classes 2 and 3 as determined by Forrest et al. (2010) and Roden et al. (2012).

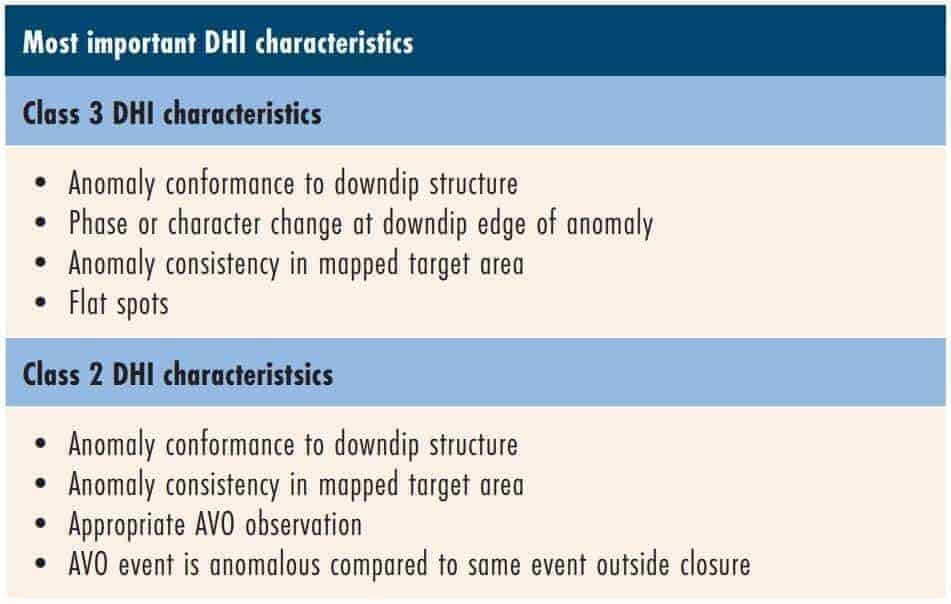
DHI characteristics are usually associated with anomalous seismic responses in a trapping configuration: structural traps, stratigraphic traps, or a combination of both. These include bright spots, flat spots, amplitude conformance to structure, etc. DHI anomalies are also compared to other features such as models, similar events, background trends, proven productive anomalies, and geologic features. DHI indicators can also be located below presumed trapped hydrocarbons where shadow zones or velocity pull-down effects may be present. DHI effects can even be present dispersed in the sediment column in the form of gas chimneys or clouds. Forrest et al. (2010) and Roden et al. (2012) have documented the most important DHI characteristics based on well success rates in an industry-wide database of DHI prospects. Other than the amplitude strength above background (bright spots), Table 1 lists these DHI characteristics by AVO classes 2 and 3. These two AVO classes (Rutherford and Williams, 1989) relate to the amplitude with offset response from the top of gas sands which represent the specific geologic settings where most DHI characteristics are found. Therefore, the application of machine learning employing seismic multi-attribute analysis may help to clearly define DHI characteristics and assist the interpreter in making a more accurate assessment of prospect risk.

Common Instantaneous Attributes
Table 2. Most important Class 3 DHI characteristics as denoted by Forrest et al. (2010) and Roden et al. (2012) and a designation of typical instantaneous attributes that identify these characteristics. Not all instantaneous attributes by themselves are conducive to identifying the top DHI characteristics.
Multi-attribute machine learning workflow

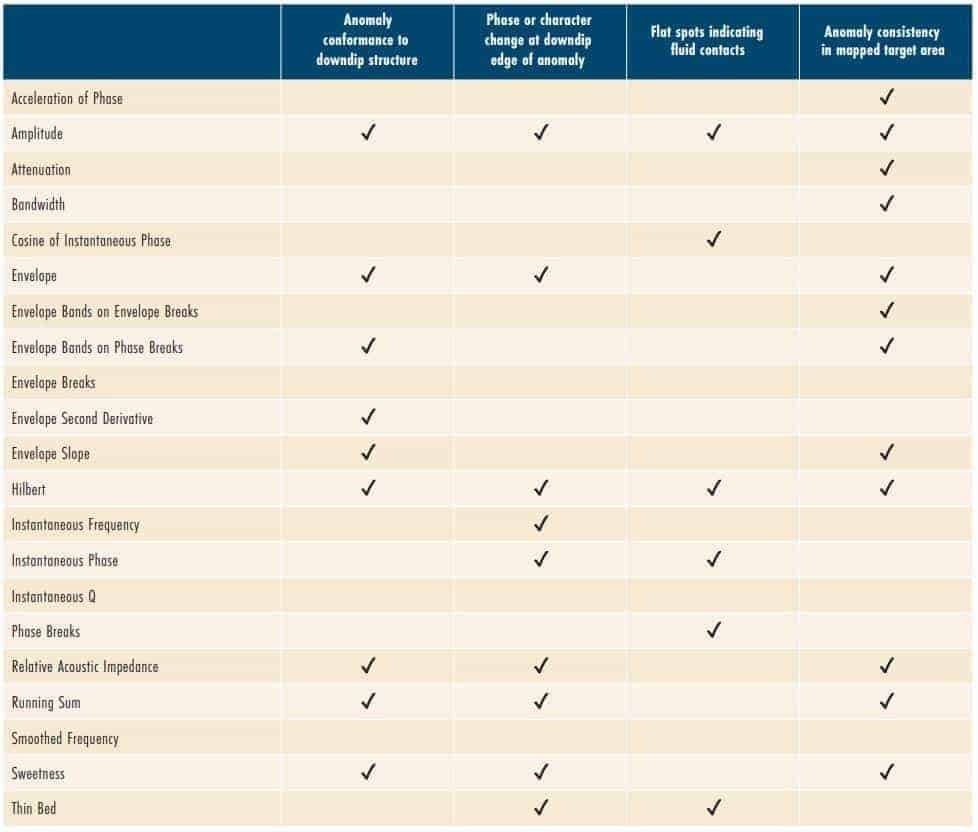
With the goal of identifying DHI characteristics, an interpreter must determine the specific attributes to employ in a machine learning workflow. A geoscientist can select appropriate attributes based on their previous knowledge and experience to define DHIs in a specific play or trend. Table 2 lists several common instantaneous attributes and the associated stacked seismic data DHI characteristics they tend to identify. These relationships are of course subjective and depend on the geologic setting and data quality. Class 3 DHIs are usually interpreted on full stack volumes and/or offset/angle volumes and their associated derivative products. Class 2 DHIs are typically interpreted on offset/angle volumes (especially far offset/angle volumes), gathers, and their associated derivative products including various types of crossplots. The relationships between attributes and DHI characteristics can be variable depending on the geologic setting and the seismic data quality. If it is unclear which attributes to employ, principal component analysis (PCA) can assist interpreters. PCA is a linear mathematical technique to reduce a large set of variables (seismic attributes) to a smaller set that still contains most of the variation of independent information in the larger set. In other words, PCA helps to determine the most meaningful seismic attributes.
The first principal component accounts for as much of the variability in the data as possible and each succeeding component (orthogonal to each preceding) accounts for as much of the remaining variability. Given a set of seismic attributes generated from the same original volume, PCA can identify combinations of attributes producing the largest variability in the data suggesting these combinations of attributes that will better identify specific geologic features of interest and in this case specific DHI characteristics. Even though the first principal component represents the largest linear attribute combinations that best represents the variability of the bulk of the data, it may not identify specific features of interest to the interpreter. The interpreter should also evaluate succeeding principal components because they may be associated with DHI characteristics not identified with the first principal component. In fact, the top contributing seismic attributes from the first few principal components, when combined, often produce the best results for DHI delineation. In other words, PCA is a tool that, employed in an interpretation workflow with a geoscientist’s knowledge of DHI related attributes, can give direction to meaningful seismic attributes and improve interpretation results. It is logical, therefore, that a PCA evaluation may provide important information on appropriate seismic attributes to take into a self-organizing map generation.

After appropriate seismic attributes have been selected, the next level of interpretation requires pattern recognition and classification of often subtle information embedded in the seismic attributes. Taking advantage of today’s computing technology, visualization techniques, and understanding of appropriate parameters, self-organizing maps (SOMs) efficiently distill multiple seismic attributes into classification and probability volumes (Smith and Taner, 2010; Roden et al., 2015). Developed by Kohonen in 1982 (Kohonen, 2001), SOM is a powerful non-linear cluster analysis and pattern recognition approach that helps interpreters to identify patterns in their data that can relate to geologic features and DHI characteristics. The samples for each of the selected seismic attributes from the desired window in a 3D survey are placed in attribute space where they are normalized or standardized to the same scale. Also in attribute space are neurons, which are points in space that start at random locations and train from the attribute data and mathematically hunt for natural clusters of information in the seismic data. After the SOM analysis, each neuron will have identified a natural cluster as a pattern in the data. These clusters reveal significant information about the classification structure of natural groups that are difficult to view any other way. In addition to the resultant classification volume, a probability volume is also generated which is a measure of the Euclidean distance from a data point to its associated winning neuron (Roden et al., 2015). The winning neuron is the one that is nearest to the data point in attribute space. It has been discovered that a low classification probability corresponds to areas that are quite anomalous as opposed to high probability zones that relate to regional and common events in the data.

To interpret the SOM classification results, each neuron is displayed in a 2D color map. Highlighting a neuron or combination of neurons in a 2D color map identifies their associated natural clusters or patterns in the survey because each seismic attribute data point retains its physical location in the 3D survey. The identification of these patterns in the data enables interpreters to define geology not easily interpreted from conventional seismic amplitude displays alone. These visual cues are facilitated by an interactive workstation environment.

Low probability anomalies

After the SOM process and natural clusters have been identified, Roden et al. (2015) describe the calculation of a classification probability. This probability estimates the probable certainty that a winning neuron classification is successful. The classification probability ranges from zero to 100% and is based on goodness of fit of the Euclidean distances between the multi-attribute data points and their associated winning neuron. Those areas in the survey where the classification probability is low correspond to areas where no winning neurons fit the data very well. In other words, anomalous regions in the survey are noted by low probability. DHI characteristics are often associated with low classification probabilities because they are anomalous features that are usually not widespread throughout the survey.

SOM analysis for Class 3 DHI characteristics

A class 3 geologic setting is associated with low acoustic impedance reservoirs that are relatively unconsolidated. These reservoirs typically have porosities greater than 25% and velocities less than 2700 m/sec. The following DHI characteristics are identified by multi-attribute SOM analyses in an offshore Gulf of Mexico class 3 setting. This location is associated with a shallow oil and gas field (approximately 1200 m) in a water depth of 140 m that displayed a high seismic amplitude response. Two producing wells with approximately 30 m of pay each were drilled in this field on the upthrown side of an east-west trending normal fault. Before these wells were drilled, operators had drilled seven unsuccessful wells in the area based on prominent seismic amplitudes that were either wet or low saturation gas. Therefore, the goal was to identify as many DHI characteristics as possible to reduce risk and accurately define the field and to develop SOM analysis approaches that can help to identify other possible prospective targets in the area.

Initially, 20 instantaneous seismic attributes were run through a PCA analysis in a zone 20ms above and 150 ms below the top of the mapped producing reservoir. Based on these PCA results, various combinations of attributes were employed in different SOM analyses with neuron counts from 3X3, 5X5, 8X8, 10X10, and 12X12 employed for each set of seismic attributes. It is from this machine learning multi-attribute interpretation workflow that the results defining different DHI characteristics were interpreted and described below. All of the figures associated with this example are from a SOM analysis with a 5X5 neuron count and employed the instantaneous attributes listed below.

  • Sweetness
  • Envelope
  • Instantaneous Frequency
  • Thin Bed
  • Relative Acoustic Impedance
  • Hilbert
  • Cosine of Instantaneous Phase
  • Final Raw Migration
SOM classification of a reservoir
Figure 1. From the top of the producing reservoir: a) time structure map in contours with an amplitude overlay in colour and b) SOM classification with low probability less than 1% denoted by white areas. The yellow line in b) represents with downdip edge of the high amplitude zone designated in a).

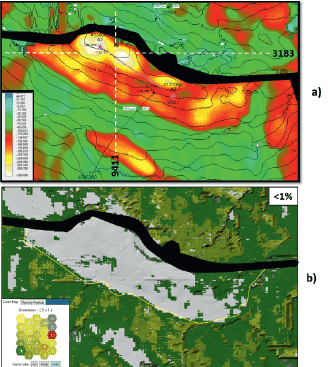
Figure 1a displays a time structure map as denoted by the contours with an amplitude overlay (color) from the mapped top of the reservoir in this field. The horizon at the top of the reservoir was picked on a trough (low impedance) on zero phase seismic data (SEG normal polarity). Figure 1a indicates that there is a relatively good amplitude conformance to structure based on the amplitude. Figure 1b is a display of classification probability from the SOM analysis at the top of the reservoir at the same scale as Figure 1a. This indicates that the top of this reservoir exhibits an anomalous response from the SOM analysis where any data points with a probability of less than 1% are displayed in the white areas. In comparing Figure 1a and 1b it is apparent that the low probability area corresponds closely to the amplitude conformance to structure as denoted by the yellow outline in Figure 1b. This confirms the identification of the productive area with low probability and proves the efficacy of this SOM approach. The consistency of the low probability SOM response in the field is another positive DHI indicator. In fact, the probabilities as low as .01% still produce a consistent response over the field indicating how the evaluation of low probability anomalies is critical in the interpretation of DHI characteristics.

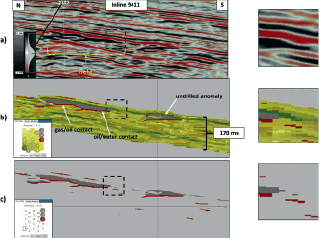
This field contains oil with a gas cap and before drilling, there were hints of possible flat spots suggesting hydrocarbon contacts on the seismic data, but the evidence was inconsistent and not definitive. Figure 2 displays a north-south vertical inline profile through the middle of the field and its location is denoted in Figure 1Figure 2a exhibits the initial stacked amplitude data with the location of the field annotated. Figure 2b denotes the SOM analysis results of this same vertical inline 9411 which incorporated the eight instantaneous attributes listed above in a 5X5 neuron matrix. The associated 2D color map in Figure 2b denotes the 25 natural patterns or clusters identified from the SOM process. It is apparent in this figure that the reservoir and portions of the gas/oil contact and the oil/water contact are easily identified. This is more easily seen in Figure 2c where the 2D color map indicates that the neurons highlighted in grey (20 and 25) are defining the hydrocarbon-bearing portions of the reservoir above the hydrocarbon contacts and the flat spots interpreted as hydrocarbon contacts are designated by the rust-colored neuron (15). The location of the reservoir and hydrocarbon contacts are corroborated by well control. The southern edge of the reservoir is revealed in the enlargements of the column displays on the right. Downdip of the field is another undrilled anomaly defined by the SOM analysis that exhibits similar DHI characteristics identified by the same neurons.

stacked seismic amplitude display
Figure 2 North-south vertical profile 9411 through the middle of the field: a) stacked seismic amplitude display with the field location designated, b) SOM classification with 25 neurons indicated by the 2D colour map over a 170 ms window, and c) three neurons highlighting the reservoir above the oil/water and gas/oil contacts and the hydrocarbon contacts (flat spots). The expanded insets denote the details from the SOM results at the downdip edge of the field.

oil-water contact
Figure 3. West-east vertical profile 3183 through the field: a) stacked seismic amplitude display denoting tie with line 9411, b) SOM classification with 25 neurons indicated by the 2D colour map, and c) three neurons highlighting the gas/oil and oil/water contacts and the hydrocarbon contacts (flat spots). The expanded insets clearly display the edge of the field in the SOM classifications.

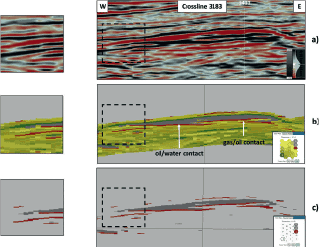
West to east crossline 3179 over the field is displayed in Figure 3 and with it the location designated in Figure 1. The stacked seismic amplitude display of Figure 3a indicates that its tie with inline 9411 is located in the updip portion of the reservoir where there is an apparent gas/oil contact. Figure 3b exhibits the SOM results of this west-east line utilizing 25 neurons as designated by the 2D color map. Similar to Figure 2bFigure 3b indicates that the SOM analysis has clearly defined the reservoir by the grey neurons (20 and 25) and the hydrocarbon contacts in the rust-colored neuron (15). Towards the west, the rust-colored neuron (15) denotes the oil/water contact as defined by the flat spot on this crossline. Figure 3c displays only neurons 15, 20, and 25 to clearly define the reservoir, its relationship above the hydrocarbon contacts, and the contacts themselves. The three enlargements on the left are added for detail.

What is very evident from the SOM results in both Figures 2 and 3 is a clear character change and definition of the downdip edges of the reservoir. The downdip edge definition of an interpreted trap is an important DHI characteristic that is clearly defined by the SOM analysis in this field. The expanded insets in Figures 2 and 3 indicate that the SOM results are producing higher resolution results than the amplitude data alone and the edge terminations of the field are easily interpreted. These results substantiate that the SOM process with the appropriate set of seismic attributes can exhibit thin beds better than conventional amplitude data.

SOM analysis for Class 2 DHI characteristics

A class 2 geologic setting contains reservoirs more consolidated than class 3 and the acoustic impedance of the reservoirs are about equal to the encasing sediments. Typical porosities range from 15 to 25% and velocities 2700-3600 m/sec for these reservoirs. In class 2 settings, AVO attributes play a larger role in the evaluation of DHI characteristics than in class 3 (Roden et al., 2014). This example is located onshore Texas and targets Eocene sands at approximately 1830 m deep. The initial well B was drilled just downthrown on a small southwest-northeast regional fault, with a subsequent well drilled on the upthrown side (Well A). The reservoirs in the wells are approximately 5-m thick and composed of thinly laminated sands. The tops of these sands produce a class 2 AVO response with near zero amplitude on the near offsets and an increase in negative amplitude with offset (SEG normal polarity).

time structure map
Figure 4. Time structure map at the top of the producing Eocene reservoir.

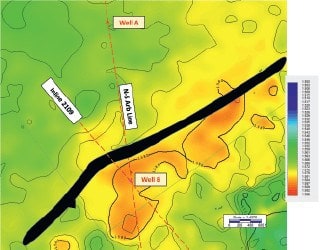
The goal of the multi-attribute analysis was to determine the full extent of the reservoirs revealed by any DHIs because both wells were performing much better than the size of the amplitude anomaly indicated from the stack and far offset seismic data. Figure 4 is a time-structure map from the top of the Eocene reservoir. This map indicates that both wells are located in stratigraphic traps with Well A situated on southeast dip and Well B located on the northwest dip that terminates into the regional fault. The defined anomaly conformance to downdip closure cannot be seen in the Well A reservoir because the areal extent of the reservoir is in a north-south channel and the downdip conformance location is
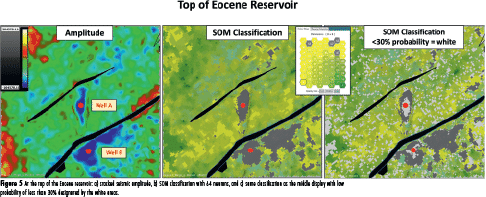
very narrow. In the Well B reservoir, the downdip edge of the reservoir actually terminates into the fault so an interpretation of the downip conformance cannot be determined. The updip portion of the reservoir at Well B actually thins out towards the south-east forming an updip seal for the stratigraphic trap. The Well B reservoir was interpreted to have a stacked data amplitude anomaly of approximately 70 acres and the Well A reservoir was determined to only have an amplitude anomaly of only about 34 acres (Figure 5a).

Amplitude -SOM classification
Figure 5.  At the top of the Eocene reservoir: a) stacked seismic amplitude, b) SOM classification with 64 neurons, and c) same classification as the middle display with low probability of less than 30% designated by the white areas.

Conventional Stacked Seismic Amplitude Display
Figure 6. North-south arbitrary line through Wells A and B with the location designated in Figure 4: a) stacked seismic amplitude display, b) SOM classification with 64neurons indicated by the 2D colour map, and c) SOM classification with only four neurons in grey highlighting both the reservoirs associated with the wells.

The gathers associated with the 3D PSTM survey over this area were conditioned and employed in the generation of very specific AVO attributes conducive to the identification of class 2 AVO anomalies in this geologic setting. The ten AVO attributes used for the SOM analysis were selected from a PCA analysis of 18 AVO attributes. The AVO attributes that were selected for the SOM analysis are listed below:

  • Far – Near
  • Shuey 2 term approximation – Intercept
  • Shuey 2 term approximation – Gradient
  • Shuey 2 term approximation – 1/2 (Intercept + Gradient)
  • Shuey 2 term approximation – 1/2 (Intercept – Gradient)
  • Shuey 3 term approximation – Intercept
  • Shuey 3 term approximation – Gradient
  • Shuey 3 term approximation – 1/2 (Intercept + Gradient)
  • Verm-Hilterman approximation – Normal Incident
  • Verm-Hilterman approximation – Poisson’s Reflectivity

Several different neuron counts were generated with these ten AVO attributes and the results in the associated figures are from the 8X8 (64 neurons) count. Figure 5b displays the SOM results from the top of the Eocene reservoirs. The associated 2D color map indicates that neurons 47, 58, 62, and 63 are defining the reservoirs drilled by the two wells. Comparing the areal distribution of the amplitude defined reservoirs in 5a to the SOM defined reservoirs in Figure 5b indicates that the later is larger. In fact, the Well A amplitude defined area of 34 acres is compared to approximately 95 acres as denoted by four neurons in Figure 5b. The Well B amplitude defined reservoir area was determined to be 70 acres, whereas, the SOM defined area was determined to be approximately 200 acres. The SOM defined areal distributions were determined to be consistent with engineering and pressure data in the two wells. The anomaly consistency in the mapped target area is evident in Figure 5b and is better in defining the extent of the producing reservoirs than amplitudes.

Figure 5c displays the SOM results of 5b. However, less than 30% of the low classification probability results are displayed in white. It denotes that the core of the reservoirs at each of the well locations reveal low probability. Low probability is defining anomalous zones based on the ten AVO attributes run in the SOM classification process.

Figure 7. Northeast-southwest inline 2109 through Well B with location designated in Figure 4: a) stacked seismic amplitude display, b) SOM classification with 64 neurons as denoted by the 2D colour map, and c) SOM classification with only four grey neurons highlighting the reservoir at Well B. The expanded insets display the updip edges of the reservoir with the SOM results clearly defining the updip seal edge of the field.

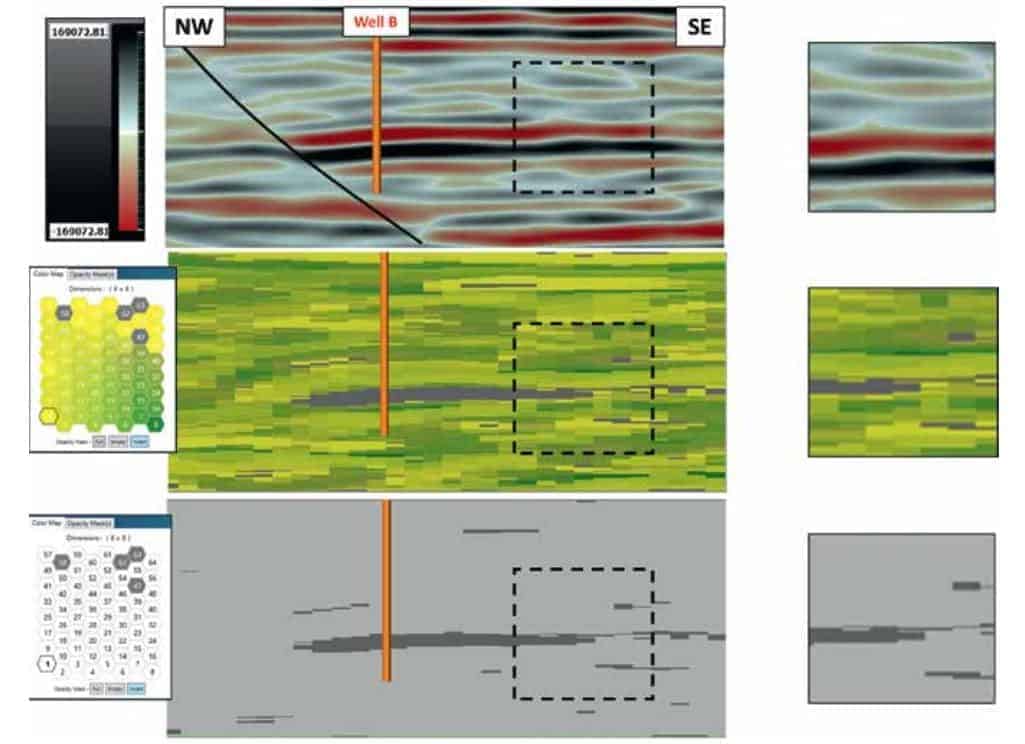
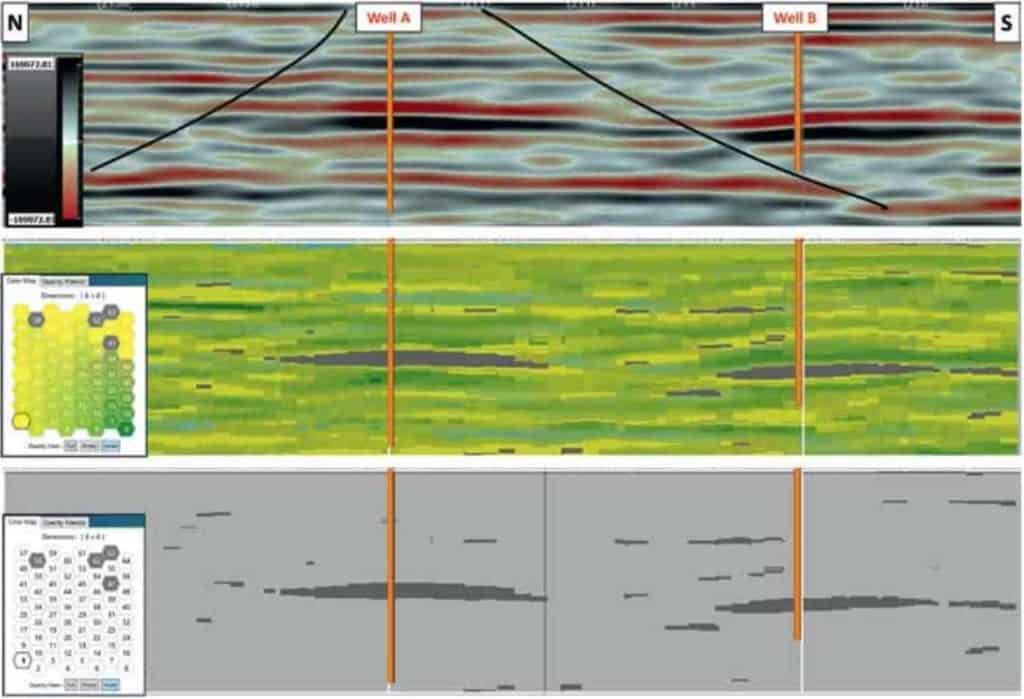
Figure 6 is a north-south arbitrary line running through both Wells A and B with its location denoted in Figure 4Figure 6a is the conventional stacked seismic amplitude display of this line. Figure 6b displays the SOM results and the reservoirs at both wells defined by neurons 47, 58, 62, and 63. In Figure 6c only these four neurons are turned on defining the location of the reservoirs on this line. The four neurons are clearly defining the field and the southern downdip limits of the reservoir associated with Well A and the updip limits of the reservoir at Well B where the sands are thinning out to the south. Figure 7 is northwest-southeast inline 2109 with its location denoted in Figure 4Figure 7a is the stacked amplitude display and Figure 7b displays the SOM results defining the limits of the Well B reservoir as it terminates at the fault to the northwest. Figure 7c with only the four neurons defining the reservoir displayed indicates the thinning out of the reservoir updip much more clearly than with amplitudes alone. The insets of Figures 7b and 7c illustrate the details in the updip portion of the reservoir defined by the SOM process. The SOM analysis incorporates ten AVO attributes and is not limited by conventional amplitude/frequency limitations of thickness and areal distribution. The AVO attributes selected for this SOM analysis are specifically designed to bring out the appropriate AVO observations for a class 2 setting. It is clear from these results that the AVO attributes in this SOM analysis are clearly distinguishing the anomalous areas associated with the producing reservoirs from the equivalent events and zones outside these stratigraphic traps.

Conclusions

For more than 40 years seismic amplitudes have been employed to interpret DHIs in an attempt to better define prospects and fields. There are dozens of DHI characteristics associated primarily with class 2 and 3 geologic settings. Hundreds of seismic attributes have been developed in an effort to derive more information from the original seismic amplitude data and further improve DHI interpretations. A machine learning workflow incorporating seismic attributes, PCA, and SOM, has been proven to produce excellent results in the interpretation of DHIs. This machine learning workflow was applied to data in class 2 and 3 reservoirs in an effort to interpret the most important DHI characteristics as defined by a worldwide industry database. The SOM analysis employing instantaneous attributes in a class 3 setting successfully identified the top DHI characteristics and especially those defining edge effects and hydrocarbon contacts (flat spots). AVO attributes conducive to providing information in class 2 settings incorporated in a SOM analysis allowed the interpretation of DHI characteristics that better defined the areal extent of the producing reservoirs than amplitudes by clearly denoting the stratigraphic trap edges.

Low SOM classification probabilities have been proven to help identify DHI characteristics. These low probabilities relate to data regions where the attributes are very different from the data points of all of the attributes in the SOM analysis and their associated winning neurons, which has defined a natural cluster or pattern in the data. Anomalous regions in the data, for example, DHI characteristics, are noted by low probability. This analytical approach of defining low probabilities proved to be helpful in identifying DHI characteristics in both class 2 and 3 settings.

An important observation in these two case studies is that the use of appropriate seismic attributes in a SOM analysis can not only identify DHI characteristics not initially interpreted but can also increase or decrease confidence in already identified characteristics. This multi-attribute machine learning workflow provides a methodology to produce more accurate identification of DHI characteristics and a better risk assessment of a geoscientist’s interpretation.

Acknowledgments

The authors would like to thank the staff of Geophysical Insights for the research and development of the machine learning applications used in this paper. We would also like to thank the Rose & Associates DHI consortium, which has provided extremely valuable information on DHI characteristics. The seismic data in the offshore case study is courtesy of Petroleum Geo-Services. Thanks also go to Deborah Sacrey and Mike Dunn for reviewing the paper. Finally, we would like to thank Tom Smith for reviewing this paper and for the inspiration to push the boundaries of interpretation technology.

References

Brown, A.B, [2004]. Interpretation of three-dimensional seismic data. AAPG Memoir 42/SEG Investigations in Geophysics No. 9, sixth edition.

Chen, Q. and Sidney, S. [1997]. Seismic attribute technology for reservoir forecasting and monitoring. The Leading Edge, 16, 445-448. Chopra, S. and Marfurt, K. [2007]. Seismic attributes for prospect identification and reservoir characterization. SEG Geophysical Development Series No. 11.

Fahmy, W.A. [2006]. DHI/AVO best practices methodology and applications: a historical perspective. SEG/EAGE Distinguished Lecture presentation.

Forrest, M., Roden, R. and Holeywell, R. [2010]. Risking seismic amplitude anomaly prospects based on database trends. The Leading Edge, 5, 936-940.

Hilterman, F.J. [2001]. Seismic amplitude interpretation. Distinguished instructor short course, SEG/EAGE. Kohonen, T. [2001]. Self Organizing Maps. Third extended addition, Springer Series in Information Services, Vol. 30.

Roden, R., Forrest, M. and Holeywell, R. [2005]. The impact of seismic amplitudes on prospect risk analysis. The Leading Edge, 7, 706-711.

Roden, R., Forrest, M. and Holeywell, R. [2012]. Relating seismic interpretation to reserve/resource calculations: Insights from a DHI consortium. The Leading Edge, 9, 1066-1074.

Roden, R., Forrest, M., Holeywell, R., Carr, M. and Alexander, P.A. [2014]. The role of AVO in prospect risk assessment. Interpretation, 2, SC61-SC76.

Roden, R., Smith, T. and Sacrey, D. [2015]. Geologic pattern recognition from seismic attributes: Principal component analysis and self-organizing maps. Interpretation, 3, SAE59-SAE83.

Rudolph, K.W. and Goulding, F.J. [2017]. Benchmarking exploration predictions and performance using 20+ yr of drilling results: One company’s experience. AAPG Bulletin, 101, 161-176.

Rutherford, S.R. and Williams, R.H. [1989]. Amplitude-versus-offset variations in gas sands: Geophysics, 54, 680-688.

Smith, T. and Taner, M.T. [2010]. Natural clusters in multi-attribute seismics found with self-organizing maps. Extended Abstracts, Robinson-Treitel Spring Symposium by GSH/SEG, March 10-11, 2010, Houston, Tx.

Taner, M.T. [2003]. Attributes revisited. http://www.rocksolidimages.com/pdf/attrib_revisited.htm, accessed 13 August 2013.

Welcome Back!

Download PDF here

OR

Request access by filling the form below to download full PDF.
Name(Required)
Most Popular Papers
Case Study: An Integrated Machine Learning-Based Fault Classification Workflow
Using machine learning to classify a 100-square-mile seismic volume in the Niobrara, geoscientists were able to interpret thin beds below ...
Case Study with Petrobras: Applying Unsupervised Multi-Attribute Machine Learning for 3D Stratigraphic Facies Classification in a Carbonate Field, Offshore Brazil
Using machine learning to classify a 100-square-mile seismic volume in the Niobrara, geoscientists were able to interpret thin beds below ...
Applying Machine Learning Technologies in the Niobrara Formation, DJ Basin, to Quickly Produce an Integrated Structural and Stratigraphic Seismic Classification Volume Calibrated to Wells
Carolan Laudon, Jie Qi, Yin-Kai Wang, Geophysical Research, LLC (d/b/a Geophysical Insights), University of Houston | Published with permission: Unconventional Resources ...
Shopping Cart
  • Registration confirmation will be emailed to you.

  • We're committed to your privacy. Geophysical Insights uses the information you provide to us to contact you about our relevant content, events, and products. You may unsubscribe from these communications at any time. For more information, check out our Privacy Policy

    Deborah SacreyOwner - Auburn Energy

    How to Use Paradise to Interpret Carbonate Reservoirs

    The key to understanding Carbonate reservoirs in Paradise start with good synthetic ties to the wavelet data. If one is not tied correctly, then it will be very east to mis-interpret the neurons as reservoir, when they are not. Secondly, the workflow should utilize Principal Component Analysis to better understand the zone of interest and the attributes to use in the SOM analysis. An important part to interpretation is understanding “Halo” and “Trailing” neurons as part of the stack around a reservoir or potential reservoir. Usually, one sees this phenomenon around deep, pressured gas reservoirs, but it can happen in shallow reservoirs as well. Two case studies are presented to emphasize the importance of looking for halo or trailing patterns around good reservoirs. One is a deep Edwards example in south central Texas, and the other a shallow oil reservoir in the Austin Chalk in the San Antonio area. Another way to help enhance carbonate reservoirs is through Spectral Decomposition. A case history is shown in the Smackover in Alabama to highlight and focus on an oolitic shoal reservoir which tunes at a specific frequency in the best wells. Not all carbonate porosity is at the top of the deposition. A case history will be discussed looking for porosity in the center portion of a reef in west Texas. And finally, one of the most difficult interpretation challenges in the carbonate spectrum is correctly mapping the interface between two carbonate layers. A simple technique is shown to help with that dilemma, by using few attributes and a low-topology count to understand regional depositional sequences. This example is from the Delaware Basin in southeastern New Mexico.

    Dr. Carrie LaudonSenior Geophysical Consultant

    Applying Unsupervised Multi-Attribute Machine Learning for 3D Stratigraphic Facies Classification in a Carbonate Field, Offshore Brazil

    We present results of a multi-attribute, machine learning study over a pre-salt carbonate field in the Santos Basin, offshore Brazil. These results test the accuracy and potential of Self-organizing maps (SOM) for stratigraphic facies delineation. The study area has an existing detailed geological facies model containing predominantly reef facies in an elongated structure.

    Carrie LaudonSenior Geophysical Consultant - Geophysical Insights

    Automatic Fault Detection and Applying Machine Learning to Detect Thin Beds

    Rapid advances in Machine Learning (ML) are transforming seismic analysis. Using these new tools, geoscientists can accomplish the following quickly and effectively:

    • Run fault detection analysis in a few hours, not weeks
    • Identify thin beds down to a single seismic sample
    • Generate seismic volumes that capture structural and stratigraphic details

    Join us for a ‘Lunch & Learn’ sessions daily at 11:00 where Dr. Carolan (“Carrie”) Laudon will review the theory and results of applying a combination of machine learning tools to obtain the above results.  A detailed agenda follows.

    Agenda

    Automated Fault Detection using 3D CNN Deep Learning

    • Deep learning fault detection
    • Synthetic models
    • Fault image enhancement
    • Semi-supervised learning for visualization
    • Application results
      • Normal faults
      • Fault/fracture trends in complex reservoirs

    Demo of Paradise Fault Detection Thoughtflow®

    Stratigraphic analysis using machine learning with fault detection

    • Attribute Selection using Principal Component Analysis (PCA)
    • Multi-Attribute Classification using Self-Organizing Maps (SOM)
    • Case studies – stratigraphic analysis and fault detection
      • Fault-karst and fracture examples, China
      • Niobrara – Stratigraphic analysis and thin beds, faults
    Thomas ChaparroSenior Geophysicist - Geophysical Insights

    Paradise: A Day in The Life of the Geoscientist

    Over the last several years, the industry has invested heavily in Machine Learning (ML) for better predictions and automation. Dramatic results have been realized in exploration, field development, and production optimization. However, many of these applications have been single use ‘point’ solutions. There is a growing body of evidence that seismic analysis is best served using a combination of ML tools for a specific objective, referred to as ML Orchestration. This talk demonstrates how the Paradise AI workbench applications are used in an integrated workflow to achieve superior results than traditional interpretation methods or single-purpose ML products. Using examples from combining ML-based Fault Detection and Stratigraphic Analysis, the talk will show how ML orchestration produces value for exploration and field development by the interpreter leveraging ML orchestration.

    Aldrin RondonSenior Geophysical Engineer - Dragon Oil

    Machine Learning Fault Detection: A Case Study

    An innovative Fault Pattern Detection Methodology has been carried out using a combination of Machine Learning Techniques to produce a seismic volume suitable for fault interpretation in a structurally and stratigraphic complex field. Through theory and results, the main objective was to demonstrate that a combination of ML tools can generate superior results in comparison with traditional attribute extraction and data manipulation through conventional algorithms. The ML technologies applied are a supervised, deep learning, fault classification followed by an unsupervised, multi-attribute classification combining fault probability and instantaneous attributes.

    Thomas ChaparroSenior Geophysicist - Geophysical Insights

    Thomas Chaparro is a Senior Geophysicist who specializes in training and preparing AI-based workflows. Thomas also has experience as a processing geophysicist and 2D and 3D seismic data processing. He has participated in projects in the Gulf of Mexico, offshore Africa, the North Sea, Australia, Alaska, and Brazil.

    Thomas holds a bachelor’s degree in Geology from Northern Arizona University and a Master’s in Geophysics from the University of California, San Diego. His research focus was computational geophysics and seismic anisotropy.

    Aldrin RondonSenior Geophysical Engineer - Dragon Oil

    Bachelor’s Degree in Geophysical Engineering from Central University in Venezuela with a specialization in Reservoir Characterization from Simon Bolivar University.

    Over 20 years exploration and development geophysical experience with extensive 2D and 3D seismic interpretation including acquisition and processing.

    Aldrin spent his formative years working on exploration activity in PDVSA Venezuela followed by a period working for a major international consultant company in the Gulf of Mexico (Landmark, Halliburton) as a G&G consultant. Latterly he was working at Helix in Scotland, UK on producing assets in the Central and South North Sea.  From 2007 to 2021, he has been working as a Senior Seismic Interpreter in Dubai involved in different dedicated development projects in the Caspian Sea.

    Deborah SacreyOwner - Auburn Energy

    How to Use Paradise to Interpret Clastic Reservoirs

    The key to understanding Clastic reservoirs in Paradise starts with good synthetic ties to the wavelet data. If one is not tied correctly, then it will be easy to mis-interpret the neurons as reservoir, whin they are not. Secondly, the workflow should utilize Principal Component Analysis to better understand the zone of interest and the attributes to use in the SOM analysis. An important part to interpretation is understanding “Halo” and “Trailing” neurons as part of the stack around a reservoir or potential reservoir. Deep, high-pressured reservoirs often “leak” or have vertical percolation into the seal. This changes the rock properties enough in the seal to create a “halo” effect in SOM. Likewise, the frequency changes of the seismic can cause a subtle “dim-out”, not necessarily observable in the wavelet data, but enough to create a different pattern in the Earth in terms of these rock property changes. Case histories for Halo and trailing neural information include deep, pressured, Chris R reservoir in Southern Louisiana, Frio pay in Southeast Texas and AVO properties in the Yegua of Wharton County. Additional case histories to highlight interpretation include thin-bed pays in Brazoria County, including updated information using CNN fault skeletonization. Continuing the process of interpretation is showing a case history in Wharton County on using Low Probability to help explore Wilcox reservoirs. Lastly, a look at using Paradise to help find sweet spots in unconventional reservoirs like the Eagle Ford, a case study provided by Patricia Santigrossi.

    Mike DunnSr. Vice President of Business Development

    Machine Learning in the Cloud

    Machine Learning in the Cloud will address the capabilities of the Paradise AI Workbench, featuring on-demand access enabled by the flexible hardware and storage facilities available on Amazon Web Services (AWS) and other commercial cloud services. Like the on-premise instance, Paradise On-Demand provides guided workflows to address many geologic challenges and investigations. The presentation will show how geoscientists can accomplish the following workflows quickly and effectively using guided ThoughtFlows® in Paradise:

    • Identify and calibrate detailed stratigraphy using seismic and well logs
    • Classify seismic facies
    • Detect faults automatically
    • Distinguish thin beds below conventional tuning
    • Interpret Direct Hydrocarbon Indicators
    • Estimate reserves/resources

    Attend the talk to see how ML applications are combined through a process called "Machine Learning Orchestration," proven to extract more from seismic and well data than traditional means.

    Sarah Stanley
    Senior Geoscientist

    Stratton Field Case Study – New Solutions to Old Problems

    The Oligocene Frio gas-producing Stratton Field in south Texas is a well-known field. Like many onshore fields, the productive sand channels are difficult to identify using conventional seismic data. However, the productive channels can be easily defined by employing several Paradise modules, including unsupervised machine learning, Principal Component Analysis, Self-Organizing Maps, 3D visualization, and the new Well Log Cross Section and Well Log Crossplot tools. The Well Log Cross Section tool generates extracted seismic data, including SOMs, along the Cross Section boreholes and logs. This extraction process enables the interpreter to accurately identify the SOM neurons associated with pay versus neurons associated with non-pay intervals. The reservoir neurons can be visualized throughout the field in the Paradise 3D Viewer, with Geobodies generated from the neurons. With this ThoughtFlow®, pay intervals previously difficult to see in conventional seismic can finally be visualized and tied back to the well data.

    Laura Cuttill
    Practice Lead, Advertas

    Young Professionals – Managing Your Personal Brand to Level-up Your Career

    No matter where you are in your career, your online “personal brand” has a huge impact on providing opportunity for prospective jobs and garnering the respect and visibility needed for advancement. While geoscientists tackle ambitious projects, publish in technical papers, and work hard to advance their careers, often, the value of these isn’t realized beyond their immediate professional circle. Learn how to…

    • - Communicate who you are to high-level executives in exploration and development
    • - Avoid common social media pitfalls
    • - Optimize your online presence to best garner attention from recruiters
    • - Stay relevant
    • - Create content of interest
    • - Establish yourself as a thought leader in your given area of specialization
    Laura Cuttill
    Practice Lead, Advertas

    As a 20-year marketing veteran marketing in oil and gas and serial entrepreneur, Laura has deep experience in bringing technology products to market and growing sales pipeline. Armed with a marketing degree from Texas A&M, she began her career doing technical writing for Schlumberger and ExxonMobil in 2001. She started Advertas as a co-founder in 2004 and began to leverage her upstream experience in marketing. In 2006, she co-founded the cyber-security software company, 2FA Technology. After growing 2FA from a startup to 75% market share in target industries, and the subsequent sale of the company, she returned to Advertas to continue working toward the success of her clients, such as Geophysical Insights. Today, she guides strategy for large-scale marketing programs, manages project execution, cultivates relationships with industry media, and advocates for data-driven, account-based marketing practices.

    Fabian Rada
    Sr. Geophysicist, Petroleum Oil & Gas Services

    Statistical Calibration of SOM results with Well Log Data (Case Study)

    The first stage of the proposed statistical method has proven to be very useful in testing whether or not there is a relationship between two qualitative variables (nominal or ordinal) or categorical quantitative variables, in the fields of health and social sciences. Its application in the oil industry allows geoscientists not only to test dependence between discrete variables, but to measure their degree of correlation (weak, moderate or strong). This article shows its application to reveal the relationship between a SOM classification volume of a set of nine seismic attributes (whose vertical sampling interval is three meters) and different well data (sedimentary facies, Net Reservoir, and effective porosity grouped by ranges). The data were prepared to construct the contingency tables, where the dependent (response) variable and independent (explanatory) variable were defined, the observed frequencies were obtained, and the frequencies that would be expected if the variables were independent were calculated and then the difference between the two magnitudes was studied using the contrast statistic called Chi-Square. The second stage implies the calibration of the SOM volume extracted along the wellbore path through statistical analysis of the petrophysical properties VCL and PHIE, and SW for each neuron, which allowed to identify the neurons with the best petrophysical values in a carbonate reservoir.

    Heather Bedle
    Assistant Professor, University of Oklahoma

    Heather Bedle received a B.S. (1999) in physics from Wake Forest University, and then worked as a systems engineer in the defense industry. She later received a M.S. (2005) and a Ph. D. (2008) degree from Northwestern University. After graduate school, she joined Chevron and worked as both a development geologist and geophysicist in the Gulf of Mexico before joining Chevron’s Energy Technology Company Unit in Houston, TX. In this position, she worked with the Rock Physics from Seismic team analyzing global assets in Chevron’s portfolio. Dr. Bedle is currently an assistant professor of applied geophysics at the University of Oklahoma’s School of Geosciences. She joined OU in 2018, after instructing at the University of Houston for two years. Dr. Bedle and her student research team at OU primarily work with seismic reflection data, using advanced techniques such as machine learning, attribute analysis, and rock physics to reveal additional structural, stratigraphic and tectonic insights of the subsurface.

    Jie Qi
    Research Geophysicist

    An Integrated Fault Detection Workflow

    Seismic fault detection is one of the top critical procedures in seismic interpretation. Identifying faults are significant for characterizing and finding the potential oil and gas reservoirs. Seismic amplitude data exhibiting good resolution and a high signal-to-noise ratio are key to identifying structural discontinuities using seismic attributes or machine learning techniques, which in turn serve as input for automatic fault extraction. Deep learning Convolutional Neural Networks (CNN) performs well on fault detection without any human-computer interactive work. This study shows an integrated CNN-based fault detection workflow to construct fault images that are sufficiently smooth for subsequent fault automatic extraction. The objectives were to suppress noise or stratigraphic anomalies subparallel to reflector dip, and sharpen fault and other discontinuities that cut reflectors, preconditioning the fault images for subsequent automatic extraction. A 2D continuous wavelet transform-based acquisition footprint suppression method was applied time slice by time slice to suppress wavenumber components to avoid interpreting the acquisition footprint as artifacts by the CNN fault detection method. To further suppress cross-cutting noise as well as sharpen fault edges, a principal component edge-preserving structure-oriented filter is also applied. The conditioned amplitude volume is then fed to a pre-trained CNN model to compute fault probability. Finally, a Laplacian of Gaussian filter is applied to the original CNN fault probability to enhance fault images. The resulting fault probability volume is favorable with respect to traditional human-interpreter generated on vertical slices through the seismic amplitude volume.

    Dr. Jie Qi
    Research Geophysicist

    An integrated machine learning-based fault classification workflow

    We introduce an integrated machine learning-based fault classification workflow that creates fault component classification volumes that greatly reduces the burden on the human interpreter. We first compute a 3D fault probability volume from pre-conditioned seismic amplitude data using a 3D convolutional neural network (CNN). However, the resulting “fault probability” volume delineates other non-fault edges such as angular unconformities, the base of mass transport complexes, and noise such as acquisition footprint. We find that image processing-based fault discontinuity enhancement and skeletonization methods can enhance the fault discontinuities and suppress many of the non-fault discontinuities. Although each fault is characterized by its dip and azimuth, these two properties are discontinuous at azimuths of φ=±180° and for near vertical faults for azimuths φ and φ+180° requiring them to be parameterized as four continuous geodetic fault components. These four fault components as well as the fault probability can then be fed into a self-organizing map (SOM) to generate fault component classification. We find that the final classification result can segment fault sets trending in interpreter-defined orientations and minimize the impact of stratigraphy and noise by selecting different neurons from the SOM 2D neuron color map.

    Ivan Marroquin
    Senior Research Geophysicist

    Connecting Multi-attribute Classification to Reservoir Properties

    Interpreters rely on seismic pattern changes to identify and map geologic features of importance. The ability to recognize such features depends on the seismic resolution and characteristics of seismic waveforms. With the advancement of machine learning algorithms, new methods for interpreting seismic data are being developed. Among these algorithms, self-organizing maps (SOM) provides a different approach to extract geological information from a set of seismic attributes.

    SOM approximates the input patterns by a finite set of processing neurons arranged in a regular 2D grid of map nodes. Such that, it classifies multi-attribute seismic samples into natural clusters following an unsupervised approach. Since machine learning is unbiased, so the classifications can contain both geological information and coherent noise. Thus, seismic interpretation evolves into broader geologic perspectives. Additionally, SOM partitions multi-attribute samples without a priori information to guide the process (e.g., well data).

    The SOM output is a new seismic attribute volume, in which geologic information is captured from the classification into winning neurons. Implicit and useful geological information are uncovered through an interactive visual inspection of winning neuron classifications. By doing so, interpreters build a classification model that aids them to gain insight into complex relationships between attribute patterns and geological features.

    Despite all these benefits, there are interpretation challenges regarding whether there is an association between winning neurons and geological features. To address these issues, a bivariate statistical approach is proposed. To evaluate this analysis, three cases scenarios are presented. In each case, the association between winning neurons and net reservoir (determined from petrophysical or well log properties) at well locations is analyzed. The results show that the statistical analysis not only aid in the identification of classification patterns; but more importantly, reservoir/not reservoir classification by classical petrophysical analysis strongly correlates with selected SOM winning neurons. Confidence in interpreted classification features is gained at the borehole and interpretation is readily extended as geobodies away from the well.

    Heather Bedle
    Assistant Professor, University of Oklahoma

    Gas Hydrates, Reefs, Channel Architecture, and Fizz Gas: SOM Applications in a Variety of Geologic Settings

    Students at the University of Oklahoma have been exploring the uses of SOM techniques for the last year. This presentation will review learnings and results from a few of these research projects. Two projects have investigated the ability of SOMs to aid in identification of pore space materials – both trying to qualitatively identify gas hydrates and under-saturated gas reservoirs. A third study investigated individual attributes and SOMs in recognizing various carbonate facies in a pinnacle reef in the Michigan Basin. The fourth study took a deep dive of various machine learning algorithms, of which SOMs will be discussed, to understand how much machine learning can aid in the identification of deepwater channel architectures.

    Fabian Rada
    Sr. Geophysicist, Petroleum Oil & Gas Servicest

    Fabian Rada joined Petroleum Oil and Gas Services, Inc (POGS) in January 2015 as Business Development Manager and Consultant to PEMEX. In Mexico, he has participated in several integrated oil and gas reservoir studies. He has consulted with PEMEX Activos and the G&G Technology group to apply the Paradise AI workbench and other tools. Since January 2015, he has been working with Geophysical Insights staff to provide and implement the multi-attribute analysis software Paradise in Petróleos Mexicanos (PEMEX), running a successful pilot test in Litoral Tabasco Tsimin Xux Asset. Mr. Rada began his career in the Venezuelan National Foundation for Seismological Research, where he participated in several geophysical projects, including seismic and gravity data for micro zonation surveys. He then joined China National Petroleum Corporation (CNPC) as QC Geophysicist until he became the Chief Geophysicist in the QA/QC Department. Then, he transitioned to a subsidiary of Petróleos de Venezuela (PDVSA), as a member of the QA/QC and Chief of Potential Field Methods section. Mr. Rada has also participated in processing land seismic data and marine seismic/gravity acquisition surveys. Mr. Rada earned a B.S. in Geophysics from the Central University of Venezuela.

    Hal GreenDirector, Marketing & Business Development - Geophysical Insights

    Introduction to Automatic Fault Detection and Applying Machine Learning to Detect Thin Beds

    Rapid advances in Machine Learning (ML) are transforming seismic analysis. Using these new tools, geoscientists can accomplish the following quickly and effectively: a combination of machine learning (ML) and deep learning applications, geoscientists apply Paradise to extract greater insights from seismic and well data for these and other objectives:

    • Run fault detection analysis in a few hours, not weeks
    • Identify thin beds down to a single seismic sample
    • Overlay fault images on stratigraphic analysis

    The brief introduction will orient you with the technology and examples of how machine learning is being applied to automate interpretation while generating new insights in the data.

    Sarah Stanley
    Senior Geoscientist and Lead Trainer

    Sarah Stanley joined Geophysical Insights in October, 2017 as a geoscience consultant, and became a full-time employee July 2018. Prior to Geophysical Insights, Sarah was employed by IHS Markit in various leadership positions from 2011 to her retirement in August 2017, including Director US Operations Training and Certification, the Operational Governance Team, and, prior to February 2013, Director of IHS Kingdom Training. Sarah joined SMT in May, 2002, and was the Director of Training for SMT until IHS Markit’s acquisition in 2011.

    Prior to joining SMT Sarah was employed by GeoQuest, a subdivision of Schlumberger, from 1998 to 2002. Sarah was also Director of the Geoscience Technology Training Center, North Harris College from 1995 to 1998, and served as a voluntary advisor on geoscience training centers to various geological societies. Sarah has over 37 years of industry experience and has worked as a petroleum geoscientist in various domestic and international plays since August of 1981. Her interpretation experience includes tight gas sands, coalbed methane, international exploration, and unconventional resources.

    Sarah holds a Bachelor’s of Science degree with majors in Biology and General Science and minor in Earth Science, a Master’s of Arts in Education and Master’s of Science in Geology from Ball State University, Muncie, Indiana. Sarah is both a Certified Petroleum Geologist, and a Registered Geologist with the State of Texas. Sarah holds teaching credentials in both Indiana and Texas.

    Sarah is a member of the Houston Geological Society and the American Association of Petroleum Geologists, where she currently serves in the AAPG House of Delegates. Sarah is a recipient of the AAPG Special Award, the AAPG House of Delegates Long Service Award, and the HGS President’s award for her work in advancing training for petroleum geoscientists. She has served on the AAPG Continuing Education Committee and was Chairman of the AAPG Technical Training Center Committee. Sarah has also served as Secretary of the HGS, and Served two years as Editor for the AAPG Division of Professional Affairs Correlator.

    Dr. Tom Smith
    President & CEO

    Dr. Tom Smith received a BS and MS degree in Geology from Iowa State University. His graduate research focused on a shallow refraction investigation of the Manson astrobleme. In 1971, he joined Chevron Geophysical as a processing geophysicist but resigned in 1980 to complete his doctoral studies in 3D modeling and migration at the Seismic Acoustics Lab at the University of Houston. Upon graduation with the Ph.D. in Geophysics in 1981, he started a geophysical consulting practice and taught seminars in seismic interpretation, seismic acquisition and seismic processing. Dr. Smith founded Seismic Micro-Technology in 1984 to develop PC software to support training workshops which subsequently led to development of the KINGDOM Software Suite for integrated geoscience interpretation with world-wide success.

    The Society of Exploration Geologists (SEG) recognized Dr. Smith’s work with the SEG Enterprise Award in 2000, and in 2010, the Geophysical Society of Houston (GSH) awarded him an Honorary Membership. Iowa State University (ISU) has recognized Dr. Smith throughout his career with the Distinguished Alumnus Lecturer Award in 1996, the Citation of Merit for National and International Recognition in 2002, and the highest alumni honor in 2015, the Distinguished Alumni Award. The University of Houston College of Natural Sciences and Mathematics recognized Dr. Smith with the 2017 Distinguished Alumni Award.

    In 2009, Dr. Smith founded Geophysical Insights, where he leads a team of geophysicists, geologists and computer scientists in developing advanced technologies for fundamental geophysical problems. The company launched the Paradise® multi-attribute analysis software in 2013, which uses Machine Learning and pattern recognition to extract greater information from seismic data.

    Dr. Smith has been a member of the SEG since 1967 and is a professional member of SEG, GSH, HGS, EAGE, SIPES, AAPG, Sigma XI, SSA and AGU. Dr. Smith served as Chairman of the SEG Foundation from 2010 to 2013. On January 25, 2016, he was recognized by the Houston Geological Society (HGS) as a geophysicist who has made significant contributions to the field of geology. He currently serves on the SEG President-Elect’s Strategy and Planning Committee and the ISU Foundation Campaign Committee for Forever True, For Iowa State.

    Carrie LaudonSenior Geophysical Consultant - Geophysical Insights

    Applying Machine Learning Technologies in the Niobrara Formation, DJ Basin, to Quickly Produce an Integrated Structural and Stratigraphic Seismic Classification Volume Calibrated to Wells

    This study will demonstrate an automated machine learning approach for fault detection in a 3D seismic volume. The result combines Deep Learning Convolution Neural Networks (CNN) with a conventional data pre-processing step and an image processing-based post processing approach to produce high quality fault attribute volumes of fault probability, fault dip magnitude and fault dip azimuth. These volumes are then combined with instantaneous attributes in an unsupervised machine learning classification, allowing the isolation of both structural and stratigraphic features into a single 3D volume. The workflow is illustrated on a 3D seismic volume from the Denver Julesburg Basin and a statistical analysis is used to calibrate results to well data.

    Ivan Marroquin
    Senior Research Geophysicist

    Iván Dimitri Marroquín is a 20-year veteran of data science research, consistently publishing in peer-reviewed journals and speaking at international conference meetings. Dr. Marroquín received a Ph.D. in geophysics from McGill University, where he conducted and participated in 3D seismic research projects. These projects focused on the development of interpretation techniques based on seismic attributes and seismic trace shape information to identify significant geological features or reservoir physical properties. Examples of his research work are attribute-based modeling to predict coalbed thickness and permeability zones, combining spectral analysis with coherency imagery technique to enhance interpretation of subtle geologic features, and implementing a visual-based data mining technique on clustering to match seismic trace shape variability to changes in reservoir properties.

    Dr. Marroquín has also conducted some ground-breaking research on seismic facies classification and volume visualization. This lead to his development of a visual-based framework that determines the optimal number of seismic facies to best reveal meaningful geologic trends in the seismic data. He proposed seismic facies classification as an alternative to data integration analysis to capture geologic information in the form of seismic facies groups. He has investigated the usefulness of mobile devices to locate, isolate, and understand the spatial relationships of important geologic features in a context-rich 3D environment. In this work, he demonstrated mobile devices are capable of performing seismic volume visualization, facilitating the interpretation of imaged geologic features.  He has definitively shown that mobile devices eventually will allow the visual examination of seismic data anywhere and at any time.

    In 2016, Dr. Marroquín joined Geophysical Insights as a senior researcher, where his efforts have been focused on developing machine learning solutions for the oil and gas industry. For his first project, he developed a novel procedure for lithofacies classification that combines a neural network with automated machine methods. In parallel, he implemented a machine learning pipeline to derive cluster centers from a trained neural network. The next step in the project is to correlate lithofacies classification to the outcome of seismic facies analysis.  Other research interests include the application of diverse machine learning technologies for analyzing and discerning trends and patterns in data related to oil and gas industry.

    Dr. Jie Qi
    Research Geophysicist

    Dr. Jie Qi is a Research Geophysicist at Geophysical Insights, where he works closely with product development and geoscience consultants. His research interests include machine learning-based fault detection, seismic interpretation, pattern recognition, image processing, seismic attribute development and interpretation, and seismic facies analysis. Dr. Qi received a BS (2011) in Geoscience from the China University of Petroleum in Beijing, and an MS (2013) in Geophysics from the University of Houston. He earned a Ph.D. (2017) in Geophysics from the University of Oklahoma, Norman. His industry experience includes work as a Research Assistant (2011-2013) at the University of Houston and the University of Oklahoma (2013-2017). Dr. Qi was with Petroleum Geo-Services (PGS), Inc. in 2014 as a summer intern, where he worked on a semi-supervised seismic facies analysis. In 2017, he served as a postdoctoral Research Associate in the Attributed Assisted-Seismic Processing and Interpretation (AASPI) consortium at the University of Oklahoma from 2017 to 2020.

    Rocky R. Roden
    Senior Consulting Geophysicist

    The Relationship of Self-Organization, Geology, and Machine Learning

    Self-organization is the nonlinear formation of spatial and temporal structures, patterns or functions in complex systems (Aschwanden et al., 2018). Simple examples of self-organization include flocks of birds, schools of fish, crystal development, formation of snowflakes, and fractals. What these examples have in common is the appearance of structure or patterns without centralized control. Self-organizing systems are typically governed by power laws, such as the Gutenberg-Richter law of earthquake frequency and magnitude. In addition, the time frames of such systems display a characteristic self-similar (fractal) response, where earthquakes or avalanches for example, occur over all possible time scales (Baas, 2002).

    The existence of nonlinear dynamic systems and ordered structures in the earth are well known and have been studied for centuries and can appear as sedimentary features, layered and folded structures, stratigraphic formations, diapirs, eolian dune systems, channelized fluvial and deltaic systems, and many more (Budd, et al., 2014; Dietrich and Jacob, 2018). Each of these geologic processes and features exhibit patterns through the action of undirected local dynamics and is generally termed “self-organization” (Paola, 2014).

    Artificial intelligence and specifically neural networks exhibit and reveal self-organization characteristics. The reason for the interest in applying neural networks stems from the fact that they are universal approximators for various kinds of nonlinear dynamical systems of arbitrary complexity (Pessa, 2008). A special class of artificial neural networks is aptly named self-organizing map (SOM) (Kohonen, 1982). It has been found that SOM can identify significant organizational structure in the form of clusters from seismic attributes that relate to geologic features (Strecker and Uden, 2002; Coleou et al., 2003; de Matos, 2006; Roy et al., 2013; Roden et al., 2015; Zhao et al., 2016; Roden et al., 2017; Zhao et al., 2017; Roden and Chen, 2017; Sacrey and Roden, 2018; Leal et al, 2019; Hussein et al., 2020; Hardage et al., 2020; Manauchehri et al., 2020). As a consequence, SOM is an excellent machine learning neural network approach utilizing seismic attributes to help identify self-organization features and define natural geologic patterns not easily seen or seen at all in the data.

    Rocky R. Roden
    Senior Consulting Geophysicist

    Rocky R. Roden started his own consulting company, Rocky Ridge Resources Inc. in 2003 and works with several oil companies on technical and prospect evaluation issues. He is also a principal in the Rose and Associates DHI Risk Analysis Consortium and was Chief Consulting Geophysicist with Seismic Micro-technology. Rocky is a proven oil finder with 37 years in the industry, gaining extensive knowledge of modern geoscience technical approaches.

    Rocky holds a BS in Oceanographic Technology-Geology from Lamar University and a MS in Geological and Geophysical Oceanography from Texas A&M University. As Chief Geophysicist and Director of Applied Technology for Repsol-YPF, his role comprised of advising corporate officers, geoscientists, and managers on interpretation, strategy and technical analysis for exploration and development in offices in the U.S., Argentina, Spain, Egypt, Bolivia, Ecuador, Peru, Brazil, Venezuela, Malaysia, and Indonesia. He has been involved in the technical and economic evaluation of Gulf of Mexico lease sales, farmouts worldwide, and bid rounds in South America, Europe, and the Far East. Previous work experience includes exploration and development at Maxus Energy, Pogo Producing, Decca Survey, and Texaco. Rocky is a member of SEG, AAPG, HGS, GSH, EAGE, and SIPES; he is also a past Chairman of The Leading Edge Editorial Board.

    Bob A. Hardage

    Bob A. Hardage received a PhD in physics from Oklahoma State University. His thesis work focused on high-velocity micro-meteoroid impact on space vehicles, which required trips to Goddard Space Flight Center to do finite-difference modeling on dedicated computers. Upon completing his university studies, he worked at Phillips Petroleum Company for 23 years and was Exploration Manager for Asia and Latin America when he left Phillips. He moved to WesternAtlas and worked 3 years as Vice President of Geophysical Development and Marketing. He then established a multicomponent seismic research laboratory at the Bureau of Economic Geology and served The University of Texas at Austin as a Senior Research Scientist for 28 years. He has published books on VSP, cross-well profiling, seismic stratigraphy, and multicomponent seismic technology. He was the first person to serve 6 years on the Board of Directors of the Society of Exploration Geophysicists (SEG). His Board service was as SEG Editor (2 years), followed by 1-year terms as First VP, President Elect, President, and Past President. SEG has awarded him a Special Commendation, Life Membership, and Honorary Membership. He wrote the AAPG Explorer column on geophysics for 6 years. AAPG honored him with a Distinguished Service award for promoting geophysics among the geological community.

    Bob A. Hardage

    Investigating the Internal Fabric of VSP data with Attribute Analysis and Unsupervised Machine Learning

    Examination of vertical seismic profile (VSP) data with unsupervised machine learning technology is a rigorous way to compare the fabric of down-going, illuminating, P and S wavefields with the fabric of up-going reflections and interbed multiples created by these wavefields. This concept is introduced in this paper by applying unsupervised learning to VSP data to better understand the physics of P and S reflection seismology. The zero-offset VSP data used in this investigation were acquired in a hard-rock, fast-velocity, environment that caused the shallowest 2 or 3 geophones to be inside the near-field radiation zone of a vertical-vibrator baseplate. This study shows how to use instantaneous attributes to backtrack down-going direct-P and direct-S illuminating wavelets to the vibrator baseplate inside the near-field zone. This backtracking confirms that the points-of-origin of direct-P and direct-S are identical. The investigation then applies principal component (PCA) analysis to VSP data and shows that direct-S and direct-P wavefields that are created simultaneously at a vertical-vibrator baseplate have the same dominant principal components. A self-organizing map (SOM) approach is then taken to illustrate how unsupervised machine learning describes the fabric of down-going and up-going events embedded in vertical-geophone VSP data. These SOM results show that a small number of specific neurons build the down-going direct-P illuminating wavefield, and another small group of neurons build up-going P primary reflections and early-arriving down-going P multiples. The internal attribute fabric of these key down-going and up-going neurons are then compared to expose their similarities and differences. This initial study indicates that unsupervised machine learning, when applied to VSP data, is a powerful tool for understanding the physics of seismic reflectivity at a prospect. This research strategy of analyzing VSP data with unsupervised machine learning will now expand to horizontal-geophone VSP data.

    Tom Smith
    President and CEO, Geophysical Insights

    Machine Learning for Incomplete Geoscientists

    This presentation covers big-picture machine learning buzz words with humor and unassailable frankness. The goal of the material is for every geoscientist to gain confidence in these important concepts and how they add to our well-established practices, particularly seismic interpretation. Presentation topics include a machine learning historical perspective, what makes it different, a fish factory, Shazam, comparison of supervised and unsupervised machine learning methods with examples, tuning thickness, deep learning, hard/soft attribute spaces, multi-attribute samples, and several interpretation examples. After the presentation, you may not know how to run machine learning algorithms, but you should be able to appreciate their value and avoid some of their limitations.

    Deborah Sacrey
    Owner, Auburn Energy

    Deborah is a geologist/geophysicist with 44 years of oil and gas exploration experience in Texas, Louisiana Gulf Coast and Mid-Continent areas of the US. She received her degree in Geology from the University of Oklahoma in 1976 and immediately started working for Gulf Oil in their Oklahoma City offices.

    She started her own company, Auburn Energy, in 1990 and built her first geophysical workstation using Kingdom software in 1996. She helped SMT/IHS for 18 years in developing and testing the Kingdom Software. She specializes in 2D and 3D interpretation for clients in the US and internationally. For the past nine years she has been part of a team to study and bring the power of multi-attribute neural analysis of seismic data to the geoscience public, guided by Dr. Tom Smith, founder of SMT. She has become an expert in the use of Paradise software and has seven discoveries for clients using multi-attribute neural analysis.

    Deborah has been very active in the geological community. She is past national President of SIPES (Society of Independent Professional Earth Scientists), past President of the Division of Professional Affairs of AAPG (American Association of Petroleum Geologists), Past Treasurer of AAPG and Past President of the Houston Geological Society. She is also Past President of the Gulf Coast Association of Geological Societies and just ended a term as one of the GCAGS representatives on the AAPG Advisory Council. Deborah is also a DPA Certified Petroleum Geologist #4014 and DPA Certified Petroleum Geophysicist #2. She belongs to AAPG, SIPES, Houston Geological Society, South Texas Geological Society and the Oklahoma City Geological Society (OCGS).

    Mike Dunn
    Senior Vice President Business Development

    Michael A. Dunn is an exploration executive with extensive global experience including the Gulf of Mexico, Central America, Australia, China and North Africa. Mr. Dunn has a proven a track record of successfully executing exploration strategies built on a foundation of new and innovative technologies. Currently, Michael serves as Senior Vice President of Business Development for Geophysical Insights.

    He joined Shell in 1979 as an exploration geophysicist and party chief and held increasing levels or responsibility including Manager of Interpretation Research. In 1997, he participated in the launch of Geokinetics, which completed an IPO on the AMEX in 2007. His extensive experience with oil companies (Shell and Woodside) and the service sector (Geokinetics and Halliburton) has provided him with a unique perspective on technology and applications in oil and gas. Michael received a B.S. in Geology from Rutgers University and an M.S. in Geophysics from the University of Chicago.

    Hal GreenDirector, Marketing & Business Development - Geophysical Insights

    Hal H. Green is a marketing executive and entrepreneur in the energy industry with more than 25 years of experience in starting and managing technology companies. He holds a B.S. in Electrical Engineering from Texas A&M University and an MBA from the University of Houston. He has invested his career at the intersection of marketing and technology, with a focus on business strategy, marketing, and effective selling practices. Mr. Green has a diverse portfolio of experience in marketing technology to the hydrocarbon supply chain – from upstream exploration through downstream refining & petrochemical. Throughout his career, Mr. Green has been a proven thought-leader and entrepreneur, while supporting several tech start-ups.

    He started his career as a process engineer in the semiconductor manufacturing industry in Dallas, Texas and later launched an engineering consulting and systems integration business. Following the sale of that business in the late 80’s, he joined Setpoint in Houston, Texas where he eventually led that company’s Manufacturing Systems business. Aspen Technology acquired Setpoint in January 1996 and Mr. Green continued as Director of Business Development for the Information Management and Polymer Business Units.

    In 2004, Mr. Green founded Advertas, a full-service marketing and public relations firm serving clients in energy and technology. In 2010, Geophysical Insights retained Advertas as their marketing firm. Dr. Tom Smith, President/CEO of Geophysical Insights, soon appointed Mr. Green as Director of Marketing and Business Development for Geophysical Insights, in which capacity he still serves today.

    Hana Kabazi
    Product Manager

    Hana Kabazi joined Geophysical Insights in October of 201, and is now one of our Product Managers for Paradise. Mrs. Kabazi has over 7 years of oil and gas experience, including 5 years and Halliburton – Landmark. During her time at Landmark she held positions as a consultant to many E&P companies, technical advisor to the QA organization, and as product manager of Subsurface Mapping in DecsionSpace. Mrs. Kabazi has a B.S. in Geology from the University of Texas Austin, and an M.S. in Geology from the University of Houston.

    Dr. Carrie LaudonSenior Geophysical Consultant - Geophysical Insights

    Carolan (Carrie) Laudon holds a PhD in geophysics from the University of Minnesota and a BS in geology from the University of Wisconsin Eau Claire. She has been Senior Geophysical Consultant with Geophysical Insights since 2017 working with Paradise®, their machine learning platform. Prior roles include Vice President of Consulting Services and Microseismic Technology for Global Geophysical Services and 17 years with Schlumberger in technical, management and sales, starting in Alaska and including Aberdeen, Scotland, Houston, TX, Denver, CO and Reading, England. She spent five years early in her career with ARCO Alaska as a seismic interpreter for the Central North Slope exploration team.