In the Paradise Attributes there is a group of attributes that we refer to as Banded attributes. They are based on the envelope and instantaneous phase attributes that are part of the original instantaneous attributes as derived by Turhan Taner.
Background Information
Just a quick review of some of the foundational concepts to base our discussion of the Banded attributes calculated in Paradise. For a more detailed explanation, please refer to “Complex Trace Attributes Overview”.
This paper will illustrate Paradise instantaneous attributes on a portion of a seismic amplitude trace in the Stratton Field 3D Seismic Survey, a widely-distributed and accessible dataset available from the Bureau of Economic Geology, University of Texas. Specifically, the trace samples in this time window are from line 79, trace 89, sample 601 to 801 (time 1.2 to 1.6 by .002s).
Figure 1: The amplitude trace that all displays will be based on.
Envelope
The envelope is calculated using the vector for the real and Hilbert (imaginary) traces. We call e(t) the envelope signal. The complex time signal c(t) combines real amplitude signal a(t) and its Hilbert transform noted as H(a(t)) but shortened to H(t).
Now the complex signal is a vector with one axis pointing in the real direction and the other axis pointing in the Hilbert transform direction. The amplitude and Hilbert transform are Cartesian coordinates, X and Y, of the vector respectively.
At any instant of time the length of the vector is the Euclidean distance
We call e(t) the envelope signal.
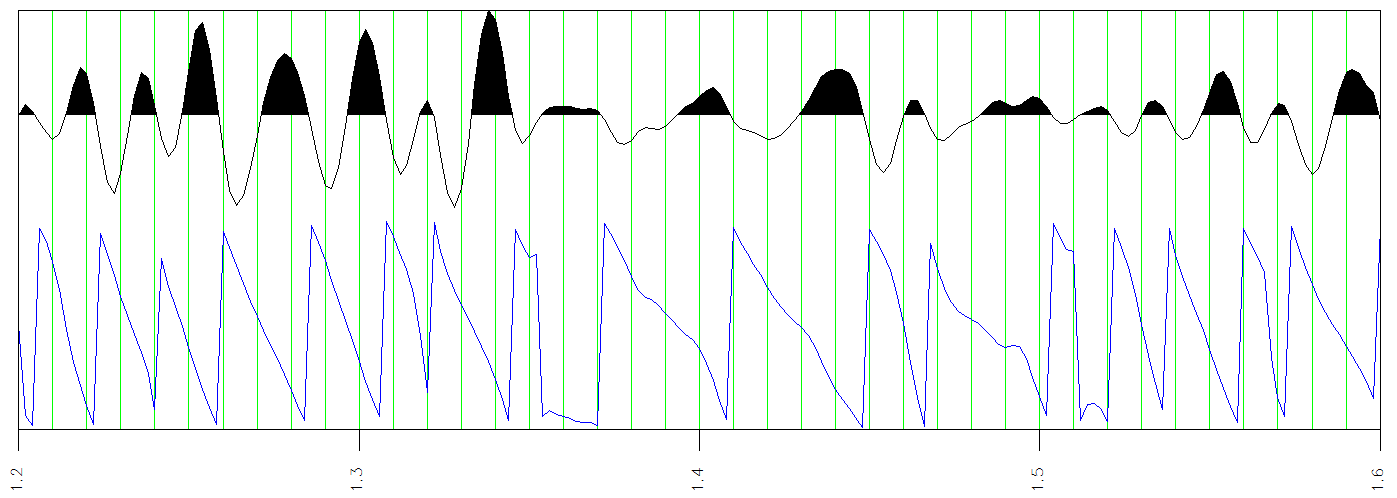
Figure 2: Envelope is red, amplitude is blue and Hilbert transformation is green.
Phase
The phase signal is found as the angle of the vector for the Euclidean distance.
Figure 3: Phase is illustrated below amplitude a(t) to correlate phase discontinuities with the period of the local reflection wavelet. Period is measured peak-to-peak or trough-to-trough and is reciprocal of frequency. Notice here that another way to estimate period is to measure time between phase discontinuities which is at every other zero crossing of amplitude.
Envelope and Phase Breaks
The group of Banded attributes are based on picked properties of a signal using either the envelope or phase attributes. The phase breaks and envelope breaks attributes represent minima that are picked from their respective attribute signals.
Phase Breaks
The first of these, phase breaks, is computed in several steps. First, smooth phase is computed as
where b(t) is a boxcar function with length of T samples and height 1/T.
Phase breaks are computed by convolving a 3-sample Hanning smoother han(t) with the Hilbert transform of the difference between the phase and the smoothed phase.
Phase breaks start by picking times of peaks of the phase breaks signal. Here is a single peak pick of the phase break signal pb(t) with an overbrace to represent a peak pick.
The pick is a vector of two elements – pick time and phase break value. The peak is a point on the phase break curve where the first derivative is zero and the second derivative is positive. A picking level controls the number of picks. It sets the threshold of phase break picking as a number of decibels below the largest peak value of phase break of the signal. Below the threshold, phase breaks simply are not picked. When the decibel range is set to zero, the threshold is ignored and all phase breaks are picked.
The ordered set of selected phase break picks is
which represents the list of all phase break picks on the phase break signal. That is, the set is the ordered set
given that
are for all
in pb(t). The number of picks is the count
From this set of peak picks, an envelope spike signal of pick times is constructed with Kronecker delta functions.
The overbrace notation here represents a picked peak signal and is the time of the i-th pick.
The result is the phase breaks attribute.
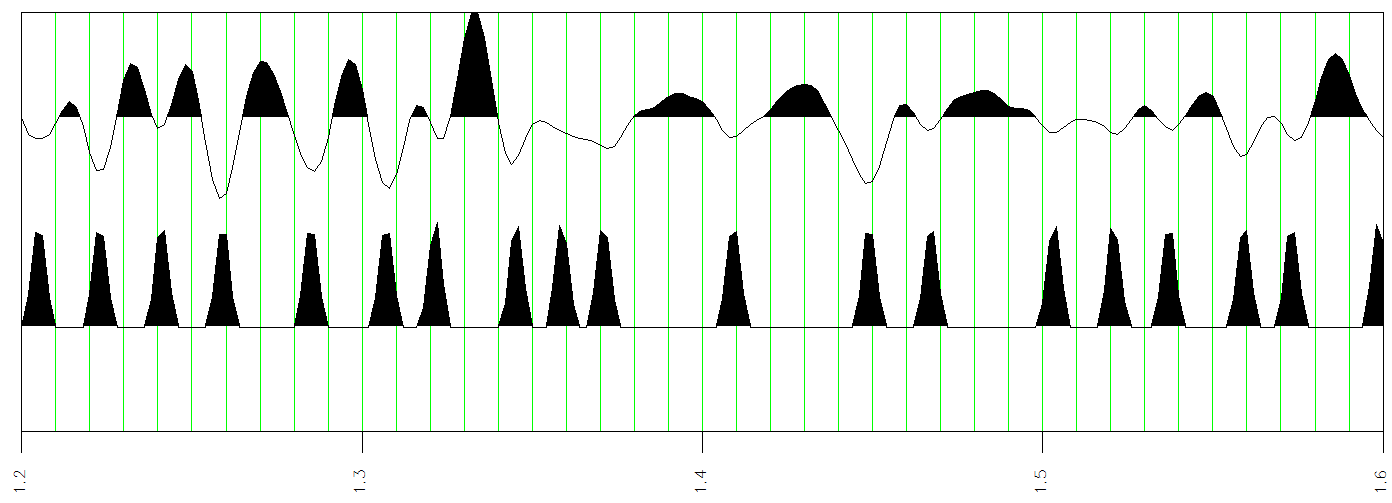
Figure 4: Phase breaks signal pb(t) below the amplitude trace marks phase discontinuities by picking peaks from a difference signal constructed by subtracting the phase signal from the smoothed phase signal
.
Envelope Breaks
Envelope breaks may also be picked on envelope minimums. They are computed in an almost equivalent way to picking peaks on phase breaks. Following the same steps as before, a single envelope minima pick of the envelope signal e(t) but with an underbrace to represent a minima pick is written.
The pick is a vector of two elements – pick time and envelope value. The minima is a point on the envelope curve where the first derivative is zero and the second derivative is negative. A picking level controls the number of picks. It sets the threshold of envelope as a number of decibels below the largest peak value of envelope of the signal. Below the threshold, minima are not picked. The threshold is ignored and all envelope minima are picked when the decibel range is set to zero.
The ordered set of all minima envelope picks is
which represents the list of all selected minima picks on the envelope signal. The number of picks
From this set of minima picks, an envelope spike signal of pick times is constructed with Kronecker delta functions.
The underbrace notation here represents a picked minima signal of spikes and is the time of the i-th pick.
The envelope breaks signal is computed by convolving a 3-sample Hanning smoother han(t) with the envelope spike signal as
This result is the envelope breaks attribute.
Figure 5: The amplitude a(t) and envelope breaks eb(t) attributes. Notice that the envelope breaks coincide with envelope minima of the envelope signal shown in Figure 2.
Banded Attributes
Banded attributes are basically taking an attribute, envelope for example, and calculating the average envelope value between either phase or envelope breaks and writing that result between the times of the breaks used to bound the calculation. If we used phase breaks, then this would give us envelope bands on phase breaks
Envelope bands on phase breaks
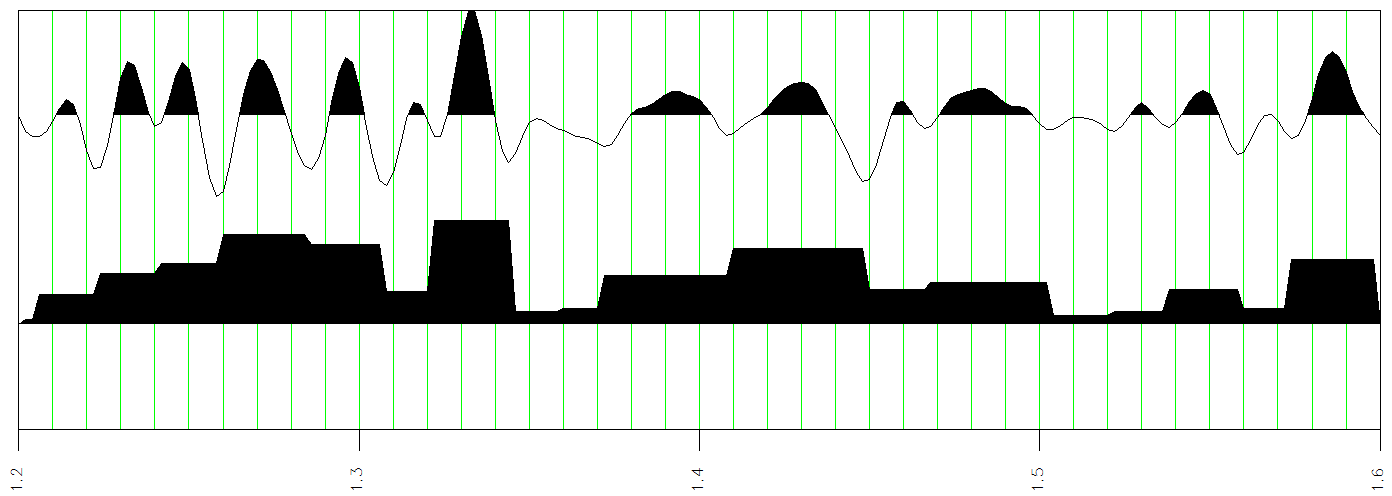
The envelope bands on phase breaks attribute integrates the envelope signal between adjacent pairs of phase breaks. Where the envelope is small the integrated value is small and the block value assigned to each sample between pairs of phase breaks is small. If the envelope is large, the block envelope value between phase breaks is large. This type of attribute helps identify regions of strong energy. The computation steps are as follows.
Assembling all the calculation components in the expression below, we have the following steps: integrate the envelope signal between adjacent pair of peak pick times and
to yield a value which will be assigned as a constant to all samples in that range (δ(tj)) and repeat these integration/assignment steps for each pair of pick times (2 to N).
This result is the envelope bands on phase breaks attribute.
The amplitude a(t) and envelope bands on phase breaks ebp(t) attributes.
Envelope Bands on Envelope Breaks
Envelope bands on envelope breaks is similar to envelope bands on phase breaks. This attribute integrates by summing the envelope signal between envelope troughs.
This result is the envelope bands on envelope breaks.
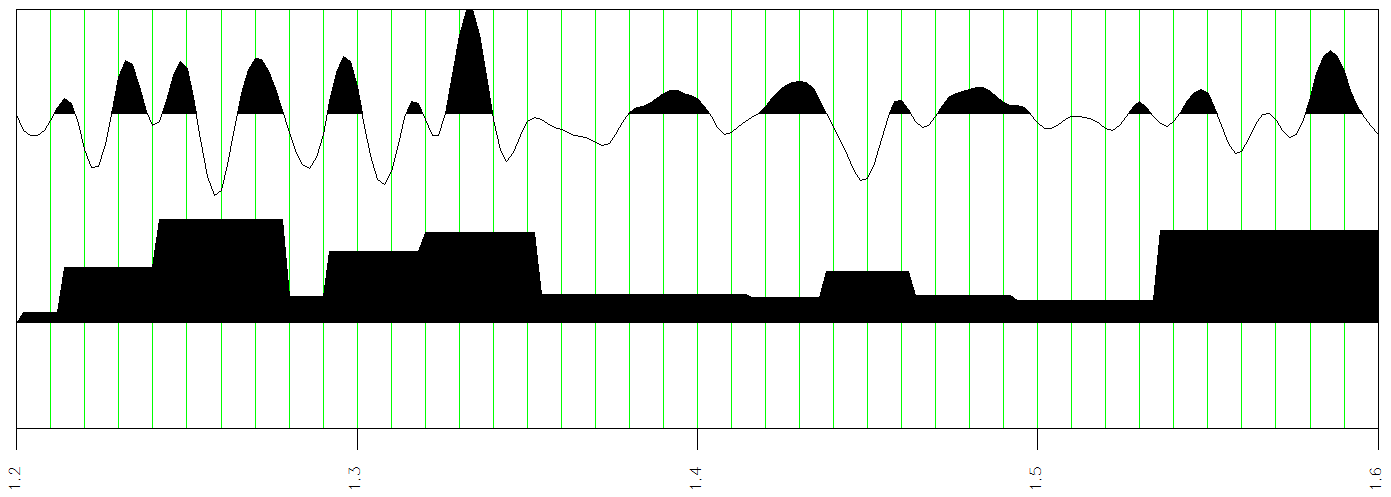
Figure 7: The amplitude a(t) and envelope bands on envelope ebe(t) attributes. Bands coincide with envelope minima as marked by envelope breaks in Figure 5. Envelope bands are integrated values of envelope between adjacent minima.
Other Banded attributes on Phase or Envelope Breaks
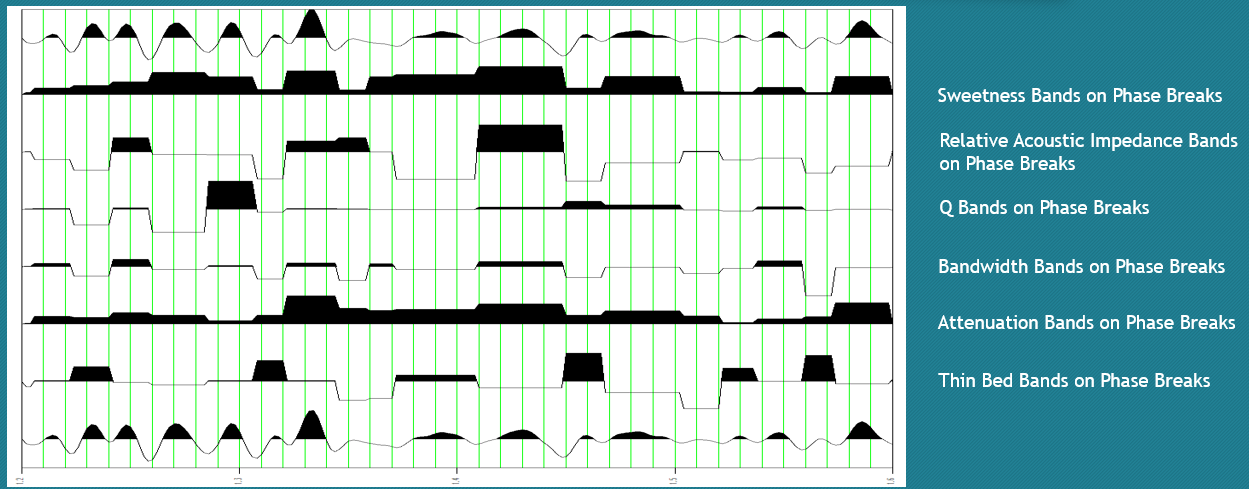
The method for calculating the average value between two phase or envelope breaks and putting that value between them can be used for any attribute and allows the interpreter to see the unit value based on that attribute in the seismic display. Since the technique is the same, the remaining bands on breaks attributes will not be discussed in detail, but will be available for the interpreter to use as desired. Note that the phase breaks tend to be more consistent and follow the wavelet closer so most of the banded attributes generated will use phase breaks
Examples of Banded Attributes, include…
- Sweetness Bands on Phase breaks
- Relative Acoustic Impedance Bands on Phase Breaks
- Quality Factor Bands on Phase Breaks
- Bandwidth Bands on Phase Breaks
- Attenuation Bands on Phase Breaks
- Thin Bed Bands on Phase Breaks
References
- Paradise Geoscience Scripting Language – PSL, A Reference Manual, 2017, Published by Geophysical Insights.
- SW0003CD. 3-D Seismic and well log data set, fluvial reservoir systems—Stratton Field, South Texas, 1994, (http://begstore.beg.utexas.edu/store/cd-rom-sets/1309-sw0003.html).
- Taner, M.T., 2003, Attributes revisited (http://www.rocksolidimages.com/attributes-revisited).
Appendix – Mathematical Notations
- Constants, variables and subscripts are lower case.
- Vectors are lower case bold.
- Sets are upper case bold.
- Sets of real, imaginary, complex and integer: ℝ,


