We present a new method for calibrating a classified 30 seismic volume. The classification process employs a Kohonen self-organizing map, a type of unsupervised artificial neural network; the subsequent calibration is performed using one or more suites of well logs. Kohonen self-organizing maps and other unsupervised clustering methods generate classes of data based on the identification of various discriminating features. These methods seek an organization in a dataset and form relational organized clusters. However, these clusters may or may not have any physical analogues in the real world. In order to relate them to the real world, we must develop a calibration method that not only defines the relationship between the clusters and real physical properties, but also provides an estimate of the validity of these relationships. With the development of this relationship, the whole dataset can then be calibrated.
The clustering step reduces the multi-dimensional data into logically smaller groups. Each original data point defined by multiple attributes is reduced to a one- or two-dimensional relational group. This establishes some logical clustering and reduces the complexity of the classification problem. Furthermore, calibration should be more successful since it will have to consider less variability in the data.
In this paper, we present a simple calibration method that employs Bayesian logic to provide the relationship between cluster centres and the real world. The output will give the most probable calibration between each self-organized map node and wellbore measured parameters such as lithology, porosity and fluid saturation. The second part of the output comprises the calibration probability.
The method is described in detail, and a case study is briefly presented using data acquired in the Orange River Basin, South Africa. The method shows promise as an alternative to current techniques for integrating seismic and log data during reservoir characterization.
INTRODUCTION
Recent changes in oil company objectives from exploration to production have been accompanied by the increased use of seismic methods for lithology prediction and reservoir characterization. A number of seismic attributes have been developed specifically for these purposes. Early successes came from using velocities and various bright spot technologies as direct hydrocarbon indicators. Subsequently, AVO (Amplitude Variation with Offset) analysis provided additional information on the lithologies and fluid contrasts across subsurface boundaries.
However, although AVO has been used successfully in many parts of the World and has evolved as a valid exploration tool, it does not provide an unambiguous definition of reservoir potential. Other seismic attributes introduced in the mid- 1970s can provide additional perspectives on subsurface geology, lithology and reservoir characteristics. For example, geometrical attributes provide information on geological and stratigraphic settings; complex trace attributes can be used to identify sequence boundaries; relative absorption can be used to indicate the presence of gas; while acoustic impedance is often an effective tool for porosity discrimination. The combined use of a number of these attributes can minimize uncertainties in reservoir assessments.
Seismic attributes relate to reservoir properties in a non-linear manner. Rock physics gives us a view of these relationships under certain assumed sets of conditions. Due to the non-linear nature of the problem, artificial neural networks are applicable and are now moving from experimental to mainstream use in the geosciences (readers are referred to Haykin (1 994) and Bishop (1999) for detailed descriptions of the technologies involved). A primary attraction of neural networks is that they can be trained to give correct predictions in complicated and non-linear cases. In one class of artificial neural network, the training is “supervised”; an example would be where input seismic data and output rock properties are provided from a training data set. In a second type of network, the training is “unsupervised”. In this latter case, the network searches for some structure or pattern in the input data set, and forms organized clusters or classes as outputs.
In this paper, we discuss a type of unsupervised neural network developed by the Finnish scientist Teuvo Kohonen, and known as a Kohonen self-organizing map (SOMj (Kohonen, 2001). We describe how an SOM can be applied to lithology prediction from seismic data. We present a brief case study from the recently discovered Ibhubesi field, Orange River Basin, western South Africa.
Lithology prediction or reservoir characterization with seismic attributes is an example of a problem that involves the reduction of many observations into a smaller number of recognizable classes. In an early example of the adaptation of the Kohonen self-organizing map technology for hydrocarbon exploration, Morice et al. (1 996) were able to discriminate lithofacies using seismic trace shape. This method provided information in the form of 2D maps or surfaces. In our method, we treat each seismic data sample as an N-dimensional vector; that is, each data sample is defined by a combination of physical and geometric seismic attributes (Carr et al., 200 1). These include amplitude, phase, instantaneous frequency, lateral continuity, and bedding geometry. This definition provides several advantages: (i) clustering and classification will be 3D rather than 2D; and (ii) clustering will be based on the combination of attributes used. Thus, if mainly geometrical attributes are used, the clustering will be based on sub-surface structural and stratigraphic morphology. If physical attributes are used, the clustering will be based predominantly on lithological differentiation. While individual attribute volumes can be a valuable interpretation aid (e.g. coherency or acoustic impedance j, their combination via Kohonen self-organizing map clustering can provide significantly greater discrimination of geology and rock properties.
KOHONEN SELF-ORGANIZING MAP CLUSTERING
Kohonen’s self-organizing maps are simple analogues of the human brain’s ability to organize information in a logical manner. The cerebral cortex of the human brain contains billions of neurons with many billions of connections (synapses) between them. It is divided into functional divisions in an orderly manner; the most important divisions are the motor cortex, sensory cortex, visual cortex and auditory cortex. The auditory cortex, for example, is subdivided into many smaller units, each functioning as cognitive parts for auditory signal recognition. It is believed that some of these are trained in a supervised manner, while others are developed in an unsupervised, self-organizing manner. Topologically adjacent cortical areas perform somewhat related cognitive functions. Kohonen’s method simulates the brain’s unsupervised learning process in an elegant and simple manner.
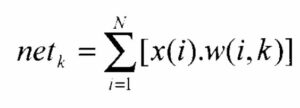
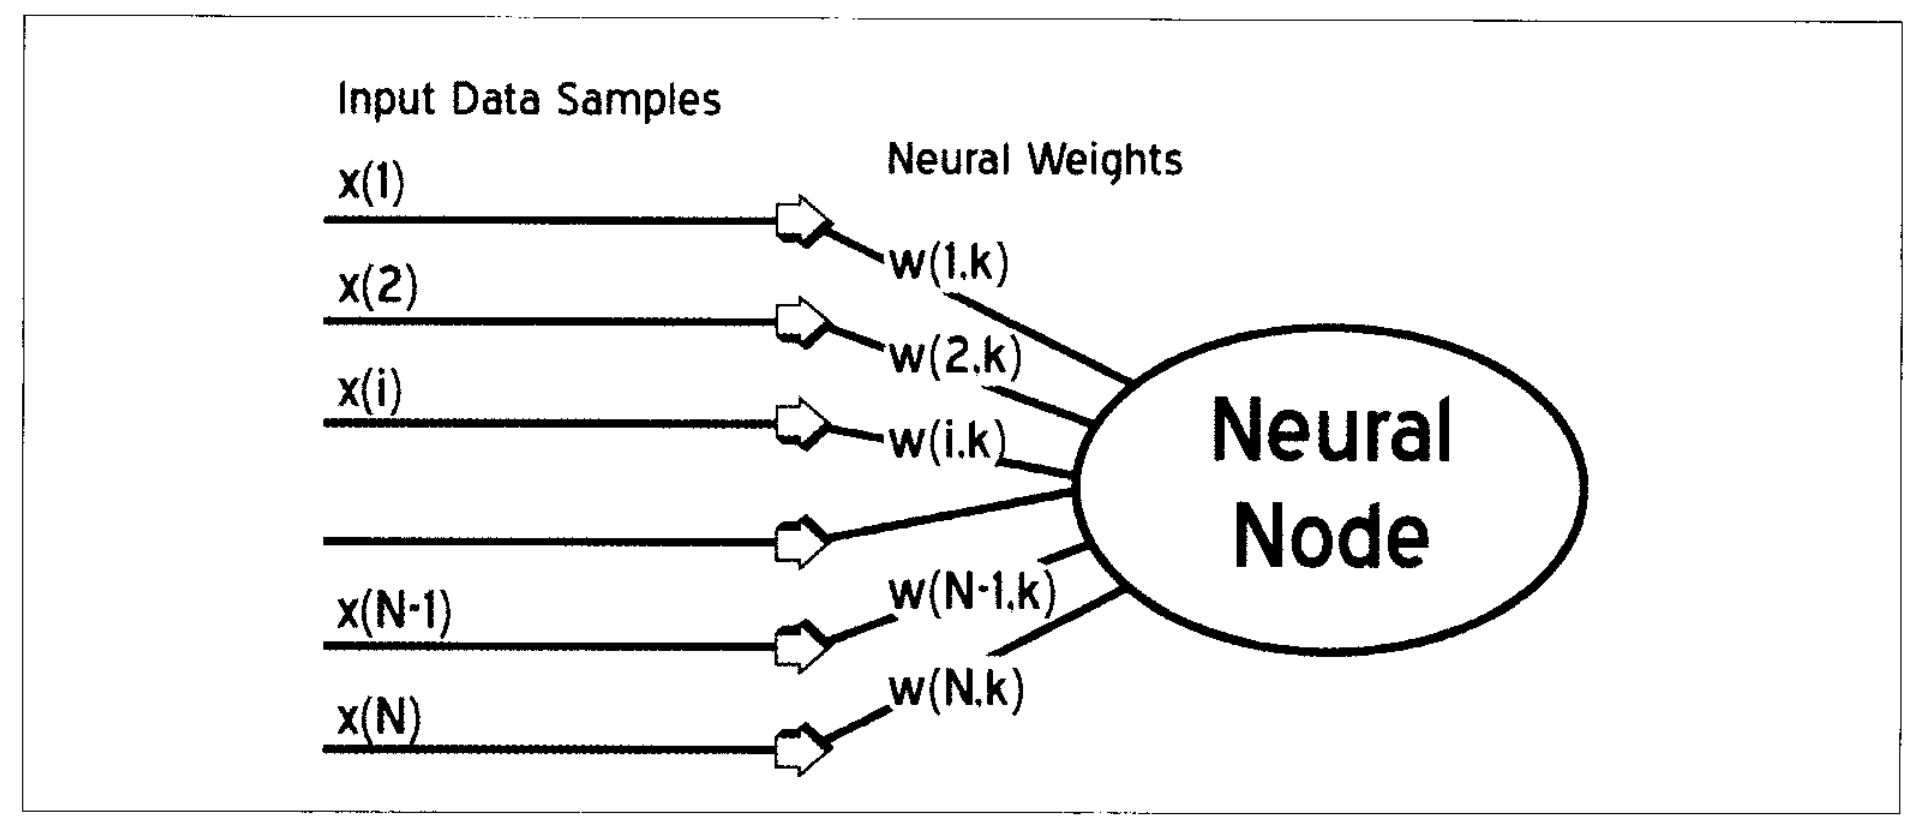
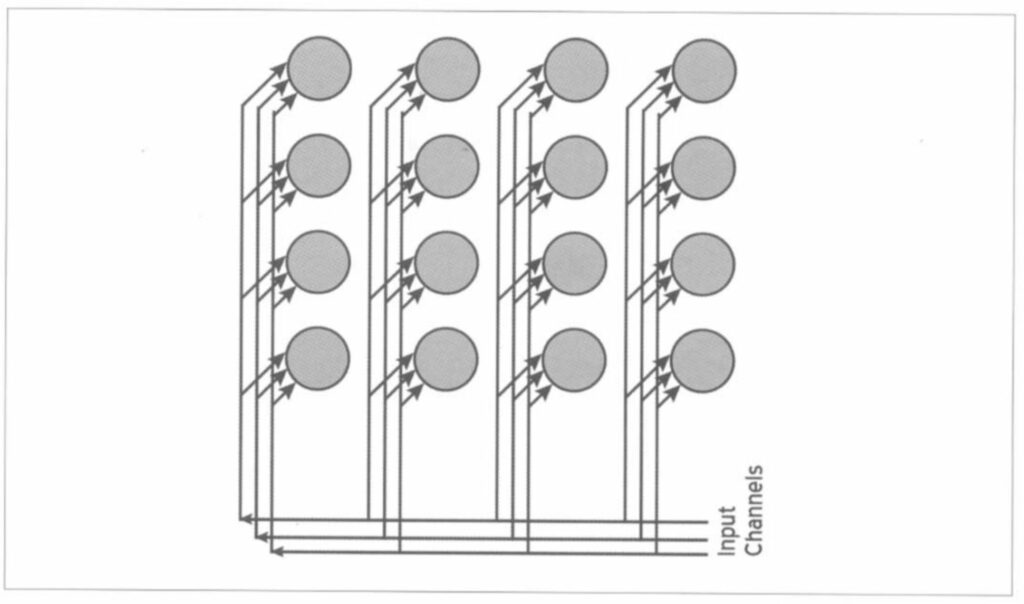
Kohonen’s self-organizing maps consist of a single layer of neurons organized in one-, two- and multi-dimensional arrays. Each neuron has as many input connections as there are attributes to be used in the classification, as shown in Fig. 1. The training procedure consists of finding the neuron with weights that are closest to the input data vector, and declaring that neuron as the “winning” neuron. There are several methods for determining the degree of similarity. In the simplest method, each input is weighted by a neuron’s corresponding weight vector and the results are summed. This represents the net input of the particular neuron. Let k represent the kth neuron where N attributes are used. Input data samples are represented by x and individual neural weights by w. Then the net input will be (in terms of a vector scalar product):
The vector scalar product (1) will give the projection of one vector onto the other. The neuron with the largest net input is selected as the winner. Then the weights of all neurons in the vicinity of the winning neuron are adjusted by an amount that is inversely proportional to the distance. The radius of the accepted vicinity is reduced as the number of iterations increases. The training process is terminated if RMS errors of all inputs are reduced to an acceptable level, or if a prescribed number of iterations is reached.
Kohonen’s method consists of one layer of neurons and uses a method of competitive learning known as “winner takes all”. Since the “winner takes all” logic may result in one neuron dominating the training, some modification is necessary. The modification scheme examines the winning rate of each neuron, and if it identifies a single dominant neuron, it then activates a “conscience” algorithm that allows other neurons to participate in the learning procedure. (Haykin, 1994)
TOPOLOGICAL ORGANIZATION
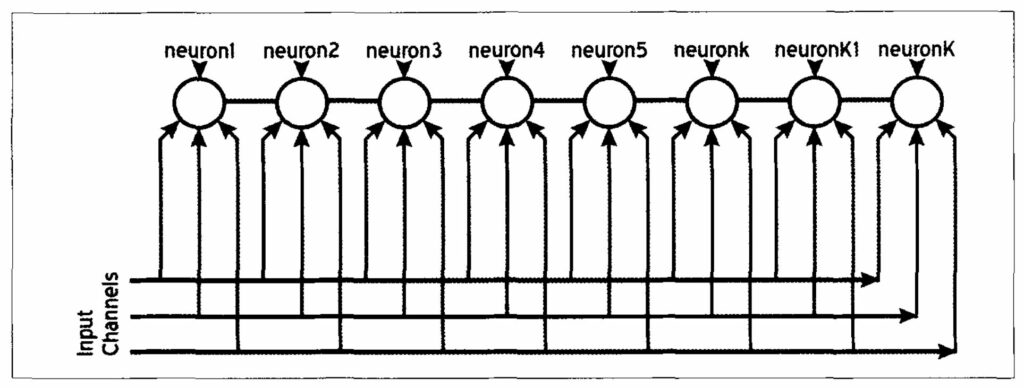
Neurons can be organized in any topological manner. Fig. 2 shows a one-dimensional organization. This will allow clustering with a one-dimensional topological relationship, that is, each adjacent neuron will have smaller differences than those located further away. The differences will gradually increase with increasing topological distance. Each neuron is connected to the input data with its own weights. In the case of the Kohonen self-organizing map, these weights will be equivalent to the actual attributes representing the mean attribute values of each cluster. This feature of the SOM is quite different from the feed-forward fully-connected class of artificial neural networks, where the weights do not relate directly to the input data.
The same characteristics will prevail in two-dimensional mapping as shown in Fig. 3. In this case, each neuron is directly connected to four neighbouring neurons. Their differences will be proportional to the topological distance between the neurons. We can think of three-dimensional mapping in the same way, although, in practice, one or two-dimensional mapping is usually employed.
CALIBRATION METHOD
In the method presented here, we used Bayesian logic to establish the relationship between lithological classes which have been identified in the borehole and the nodes on the Kohonen self-organizing map. Bayesian decision-making states that if we know the probability density of different classes of data, we can minimize the classification error by
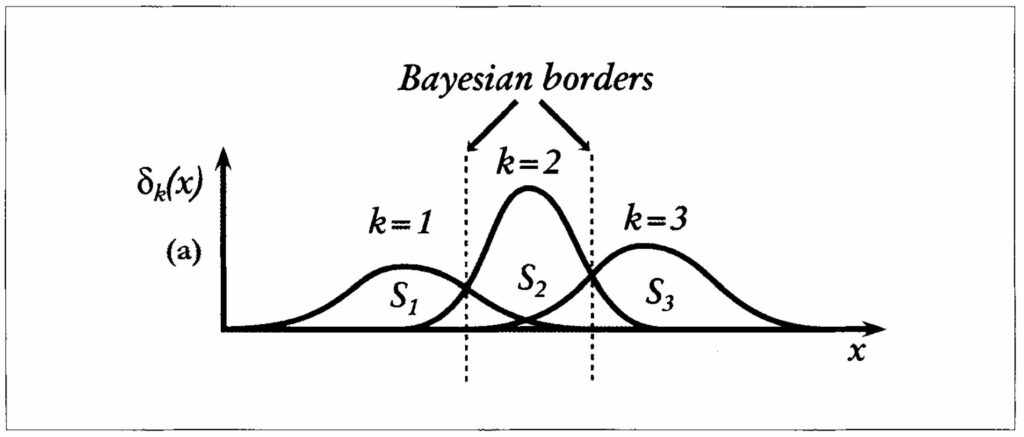
assigning a new (unknown) sample to the class with the highest probability (Duda and Hart, 1973). For example, in a one-dimensional case of three classes with their associated probability density functions (as shown in Fig. 4), we can establish Bayesian boundaries at the points of equal probabilities between each pair of classes. Therefore, any unknown data can be assigned to the class with highest probability density.

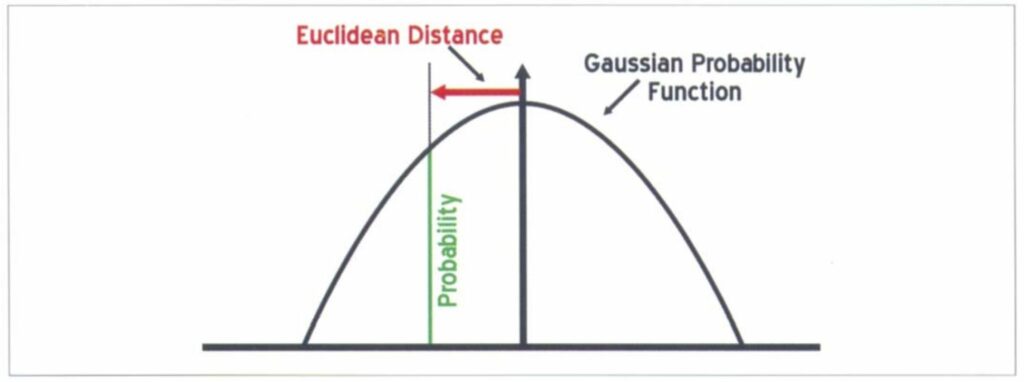
To calibrate the clusters on the Kohonen self-organizing map, we use a set of seismic training data which consists of seismic attribute values together with a set of user-assigned lithological classes, usually derived from well logs. To accomplish Bayesian classification, we compute the probability density function of each class in the SOM topology. The basis of the probability density computation is the Euclidean distance of each calibration dataset to the individual neurons in the Kohonen SOM. We assume that the closer the input data is to a particular neuron, the higher the probability will be that the neuron represents the class of the training input data. We also assume that probability density has a Gaussian distribution. Its shape will be controlled by the variance of the error between the Kohonen self-organizing map and the training data set. A smaller shaping factor will produce a sharper, more quickly-decaying Gaussian function with respect to Euclidean distance. Larger shaping factors will produce a wider, more slowly-varying function.
The first pass made through the data attempts to determine the variance of the error. This provides a basis for the Gaussian shaping factor. The Euclidean distances between data points and each neural node are computed. Let x(i,n) be the nth attribute of the ith individual training data vector, and w(k,n) the nth neural weight of the (winning) kth neuron. The Euclidean distance (Fig. 5) is computed by:
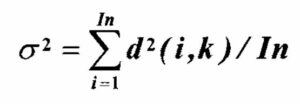
The node with the shortest distance to the input data is declared the winning neuron. This is repeated for all of the training data points and an RMS error of Euclidean distance is computed:
where In is the number of training data samples. We compute the Gaussian shaping factor such that, if the input Euclidean distance is equal to RMS error distance, the probability is equal to some constant, say 0.5. This corresponds to setting the probability to 50% if the distance is at RMS error distance. The Gaussian probability function (Fig. 6) is given by:
We determine the scale factor by setting distance equal to the RMS error which will result in = -ln.2. If we wish to make the shaping more sharp, we can decrease the value of exp.
to 0.25, and so on.
In the second pass, we compute the probability density function at each neural location for each class separately. We then compare the probability density functions and determine the class with the highest probability at each neuron. We use Equation 2 to compute the Euclidean distance between the input data and each of the neurons in the Kohonen self-organizing map. These distances are input to the Gaussian function (Equation 4) to compute the probability of classification at each neuron. These probabilities are accumulated at each neuron for each class separately. The resulting accumulated values are divided by the number of data samples belonging to that particular class.
Upon completing the computation for all classes, we produce two tables; one for the lithology classes with the highest probability for each Kohonen SOM neural node; and a companion table of corresponding probability densities. This calibration procedure can be conducted on multi-well data and is applicable for vertical, deviated and horizontal wells. Furthermore, the procedure does not require the computation of synthetic seismograms. The method is rapid and easily automated.
CASE STUDY
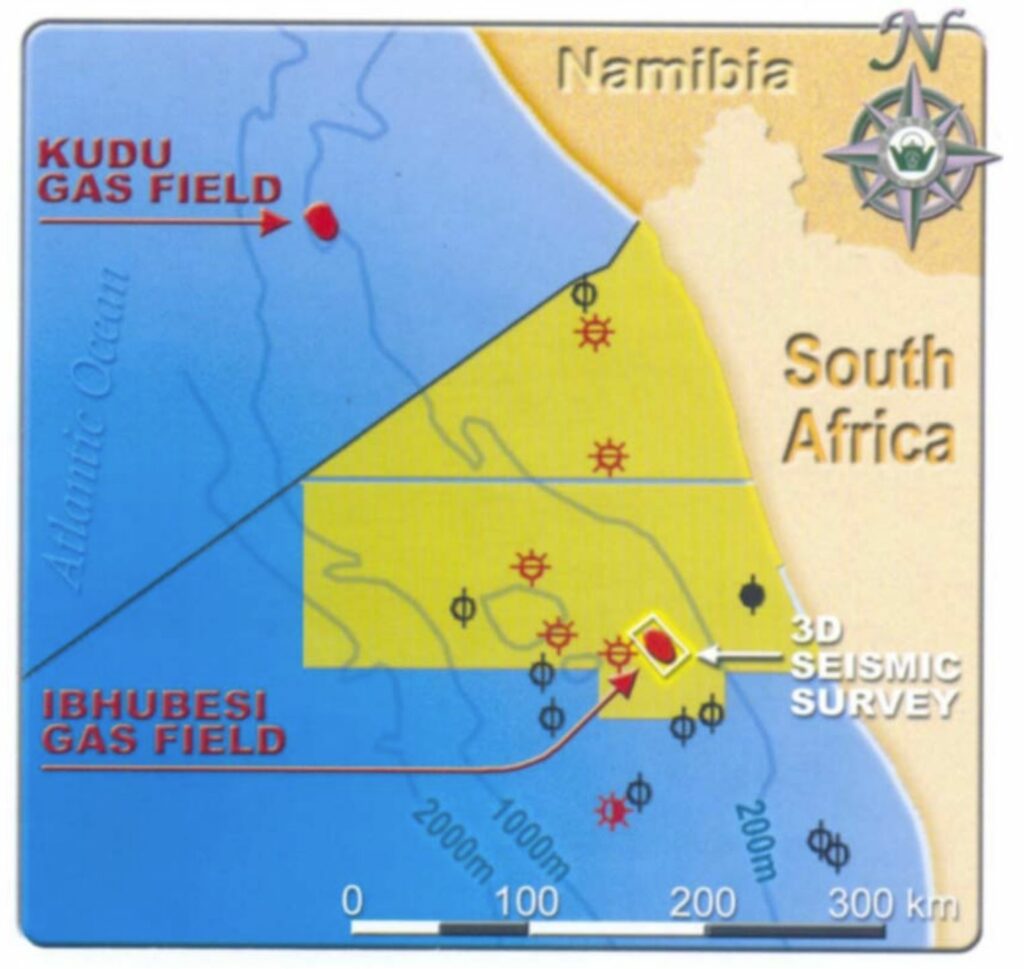
The case study focuses on the Orange River Basin, western South Africa (Fig. 7). The Orange River delta is less well known than the Niger and Congo deltas and its deepwater portion has yet to be drilled, but recent oil and gas discoveries have confirmed its exploration potential. On the basis of these discoveries, at least three hydrocarbon systems are thought to exist in the area, comprising: an oil system in the early rift succession (e.g. at well A-J1); (ii) a gas system in the late rift succession (e.g. Kudu field: Fig. 7); and (iii) a gas system in the Albian-Aptian drift succession (e.g. Ibhubesi field: Fig. 7). This case history makes use of calibrated seismic attributes for delineation of the reservoir at Ibhubesi.
In 2000, Forest Oil International shot a 312 sq. km 3D seismic survey in Block 2A around well A-K1, which had tested gas but had been abandoned in 1986. The well was thought to have tested a small non-commercial structural trap, but the 3D survey showed the trap was stratigraphic and of regional extent; it was subsequently designated the Ibhubesi field. The 3D survey area may in fact only cover a small portion in the south of the field, which could eventually produce as much as 50 TCF of gas. Attribute processing and other inversion techniques were used to predict the presence and properties of the reservoir, to assess the potential field reserves, and to plan a drilling campaign to delineate the field.
Individual gas accumulations in meandering fluvial channel deposits and other component facies of a fluvial-deltaic system were clearly identified in the resulting volumes.
A four-well drilling programme was undertaken to evaluate the field and prove-up a core development area with sufficient reserves to be developed. Each well tested individual compartments with 28 to 520 MCF gas per well. Well A-K2 tested 30 MCF gas and over 600 brls of condensate per day from a 20m thick pay sand on a 3/4” choke with a flowing tubing pressure of 2,200 psi. The reservoir characteristics were better than expected and comprised clean, well-sorted sandstone with an average porosity of 2 1 % (up to 25%) and almost no water saturation (no water was produced during testing). No significant reservoir pressure drawdown occurred during a 12 hr test.
In the second well, A-V1, a 15m gas-bearing sandbody of similar quality to that in A-K2 was found, but the drillstring twisted-off before drilling a second, deeper sand that was subsequently penetrated successfully in a sidetrack. This well confirmed the presence of additional reserves. Interestingly, the lower gas sand at A-V1 was deeper than the lowest proven gas and highest proven water at A-K1, clearly showing that this is a separate reservoir and stratigraphic trap. As the well results came in, the initial prediction of a regional-scale stratigraphic trap was gradually proved.
A third well was targeted to test the largest and brightest anomaly in the dataset, one which appeared to have the higher reserves than the other anomalies. The well penetrated two thick and porous sand units as predicted, but the reservoirs only contained water with a low gas saturation.
The fourth well, A-Y1, is currently being tested. This well encountered 60m of net pay in three zones. The lowest zone, a 2m thick sand, tested at a rate of 18 MM cf/d gas and 90 brl/d of condensate. The well flowed at 7 1 MM cf/d gas and 1,340 b/d condensate from combined tests of the upper two zones. This is the highest gas test rate so far achieved in South Africa. As a result of the drilling campaign, total reserves within the 3D area were estimated at about 1.15 TCF of gas.
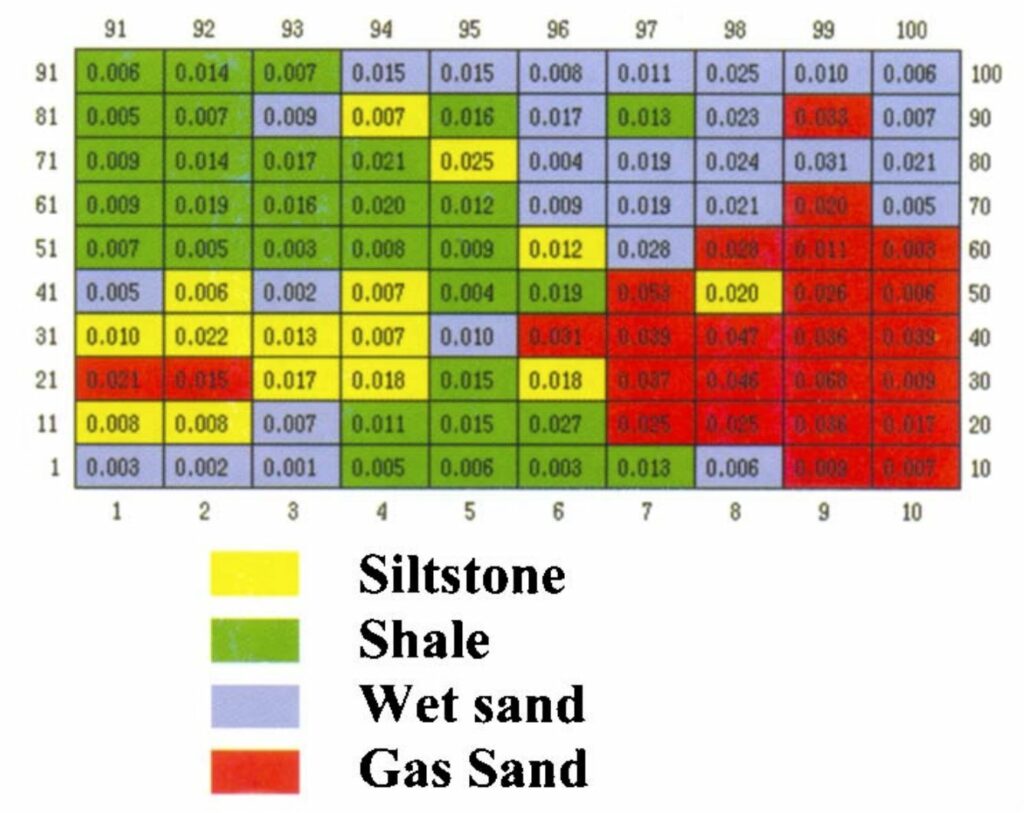
Well logs from wells AK-1 and AK-2 were used to classify four different lithologies: siltstone, shale, wet sand and gas sand. The classification was based on a combination of well log measurements including density, gamma, neutron, sonic and resistivity. Shale, siltstone and sandstone were defined by their gamma and neutron-density responses; gas sand versus wet sand were determined from the resistivity log. Well log depth values were converted to equivalent seismic time values using synthetic seismograms. In general, there were good ties over the reservoir zone.
A suite of post-stack seismic attributes was computed from the 3D seismic amplitude volume and were used as input to a Kohonen self-organizing map. The attributes used were: trace envelope, first derivative of envelope, second derivative of envelope, instantaneous phase, instantaneous frequency, bandwidth, wavelet envelope, relative acoustic impedance, dip of maximum similarity, and similarity (see Taner, 2000). These attributes represent a range of important physical and geometrical attributes and were chosen primarily from experience with other similar projects.
A 10 x 10 (1 00-class) rectangular self-organizing map topology was selected. The size of the network was chosen as the smallest that would provide a sufficient number of classes for the discrimination of subtle differences in lithology. Experience has shown that a 10 x 10 topology is generally adequate.
A relative probability value for each Kohonen class was computed. The probability function was generated using the root-mean-square (RMS) clustering distance as the 50% probability value. This provided a starting value for the Gaussian shaping factor. The maximum probability for each cluster centre was determined by comparison. The final calibration and related probabilities are shown in Fig. 8. From this calibration, each sample in the 3D survey, within a selected 2-way time interval, was identified as belonging to one of the four lithology classes.
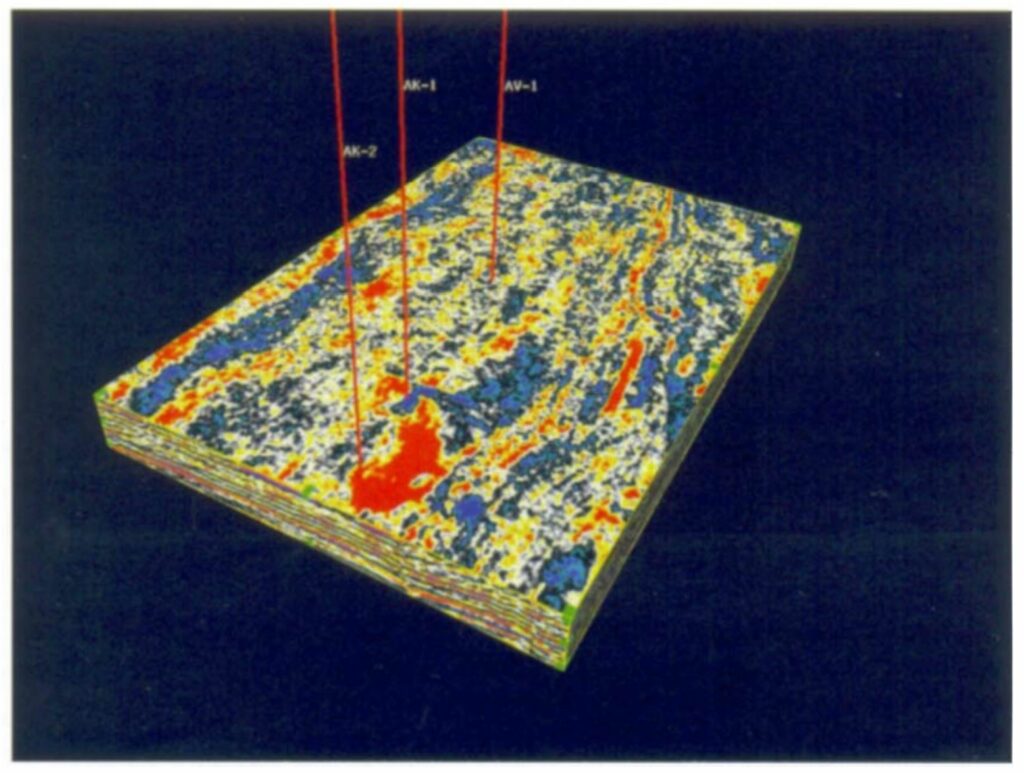
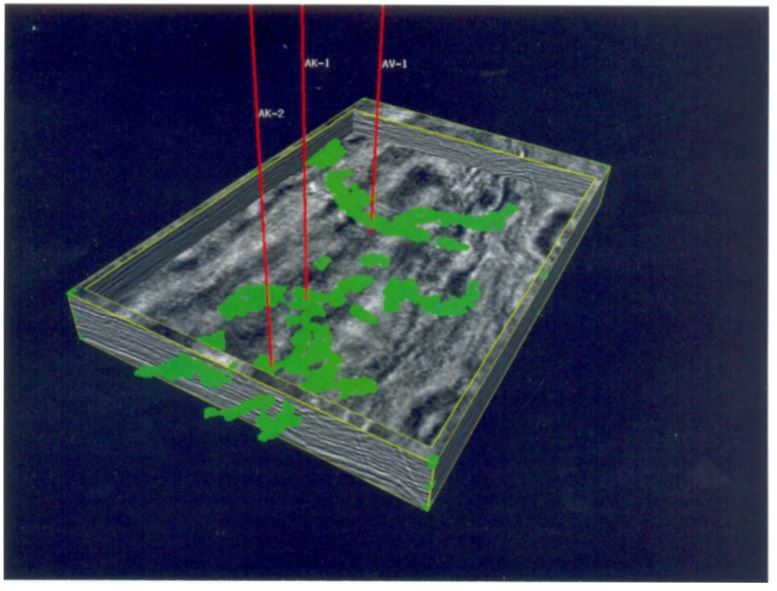
A time slice at the reservoir level from the 3D seismic amplitude volume is depicted in Fig. 9. The three wells shown are producers. The brightest amplitudes correspond mainly to the location of well AK-2. Well AK-1 is located near the edge of a high amplitude anomaly; Well AV-1 does not correspond to an amplitude anomaly. In Fig. 10, we show a seismic amplitude volume with part of the inside of the volume cut away to show the location of the 3D gas sandbodies from Bayesian calibration (in green). Each of the three producing wells appear to intersect the computed sandbodies. The sandbody class distribution is consistent with a meandering fluvial channel geometry in a fluvial-deltaic system. This analysis will be compared against future drilling results, but so far the predictions of gas sand location have been born out by drilling results.
CONCLUSIONS
In this project we used an unsupervised clustering method known as a Kohonen self-organizing map to separate a suite of seismic attributes into 100 individual classes. We then used a Bayesian logic method to redefine these classes in terms of lithology descriptions based on data from well logs. The method was tested on a dataset from the Orange River Basin, offshore South Africa. We have concluded from this work that:
- Kohonen self-organizing maps can be used to arrange multiple seismic attributes into a logical set of classes.
- These classes can be calibrated to non-seismic data such as well logs using a Bayesian logic method.
- The method was tested on a real seismic and well log dataset and was shown to provide results which were consistent with the accepted geologic and stratigraphic setting.
- We were able to discriminate at least four lithologies – siltstone, shale, wet sand and gas sand.
ACKNOWLEDGEMENTS
We would like to thank Forest Oil Corporation, Anschutz Corporation, SOEKOR and Petroleum Agency SA for the contribution of the seismic and log data used in this work. Comments by P. M. Wong (University of New South Wales) and M. Nikravesh (University of California Berkeley) on a previous version of this paper are acknowledged with thanks.
BISHOP, C. M., 1999. Neural Networks for Pattern Recognition. Oxford University Press, pp. 164-193.
CARR, M., COOPER, R., SMITH, M., TANER, M. and TAYLOR, G., 2001. The integration of surface seismic and log data to generate a rock and fluid properties volume – a South Texas Example. Presented at the 43rd Annual PBGS Exploration Meeting, Midland, Texas.
DUDA, R. 0. and HART, P.E., 1973. Pattern Classification and Scene Analysis. Wiley Interscience.
HAYKIN, S., 1994. Neural Networks, A comprehensive foundation. Macmillan Publishing Co., pp. 236-284.
KOHONEN, T., 2001. Self Organizing Maps. Springer Series in Information Sciences, 30, Springer Verlag, Berlin.
MORICE, M., KESKES, N., and JEANJEAN, F., 1996. Manual and automatic seismic facies analysis on SISMAGE Tm workstation. Annual Meeting Abstracts, Society of Exploration Geophysicists, 320- 323
OJA, F. and KASKI, S., (Eds), 1999. Kohonen Maps. Elsevier Science.
TANER, M. T., 2000. Attributes Revisited. Rock Solid Images report, Sept. 2000 (see www.rocksolidimages.com).

