he results documented in this Application Brief are from a proof-of-concept study that culminated in the acquisition of a Paradise license by the client. The evaluation was intended to demonstrate the effectiveness of the Paradise multi-attribute analysis software.
Self-Organizing Maps (SOMs) were developed from PCAs that utilize all of the attributes for the first 4 Eigenvectors. Other SOMs were comprised of a “recipe” of the top 11 attributes from the first 4 Eigenvectors:
EV1: MM Trace Envelope and MM Sweetness
EV2: MM Imaginary Part, MM RAI, MM Instantaneous Phase
EV3: Instant. Frequency, Thin Bed, Smoothed Frequency
EV4: MM Normalized Amplitude, MM Enhanced Migrated Stack (input data used for pruning), Phase Breaks / MM Paraphrase
The following issues were examined for the Viola Chocolate Brown platform carbonates:
- Evaluation of a Test location for a well;
- Compare and contrast low cumulative productivity Well #1 with high productivity Well #2.
For the Hunton / Sylvan:
- Identify play area(s) for the Hunton;
- Explain moderate cumulative production in key Well #3.
Additionally, this work identified an uncalibrated play area in the Hunton and demonstrated an ability to identify and solve correlation issues around karst features.
The results of the project demonstrated to the client that the technology could enable better well planning, help identify more productive perforation intervals, and aid in the retention of critical leases. In summary, the project was a success!
To convey a sense of the scope, deliverables, and project timeline, the following results were accomplished in 30 days:
- Extracted platform and basinal carbonate play areas
- Optimized potential TEST location
- Distinguished good from poor productivity areas (note limited productivity data)
- Helped assess efficacy of perforations for different play types
- Identified under-perforated zones
- Enabled easy high-grading of leasehold for three plays
- Results exposed critical aspects “hidden” in Client’s seismic data regarding
– Structure: Revealed unknown karst features
– Stratigraphy: Enhanced key geometries
– Rock properties: Resolved flat spots in Hunton, Viola, and Simpson that indicated likely facies contrasts, possible diagenetic changes, and/or fluid effects
Viola Findings
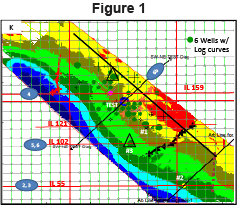
Figure 1 is a structure map on the Wichita unconformity. Synthetic T/D functions from one Viola well (north) and one Hunton well (south), indicated by black triangles, were used to tie 58 wells to this map level. Labeled in white is the proposed Test location and three key wells whose productivity was evaluated. The most prominent feature of this map is the red horst block bounded by faults.
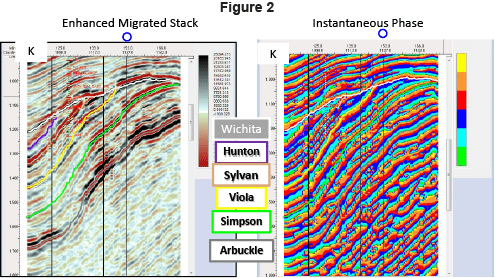
Figure 2 shows the horizons on conventional seismic opposite the instantaneous phase attribute which was used to guide the interpretation. Three interpolated horizons – Top Hunton (peak), Top Viola (trough), and Base Viola (peak) – were repicked on every line. Three additional events – the Wichita unconformity (Peak), Top Sylvan (peak) and Top Arbuckle (trough) – were picked from scratch on every line.
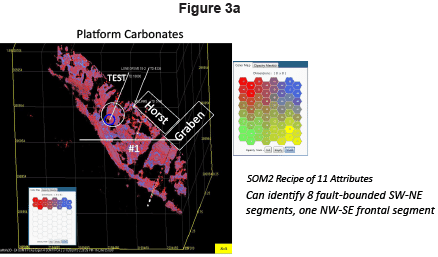
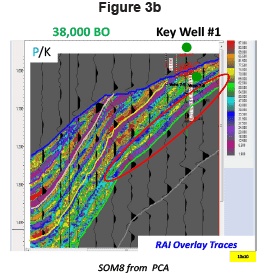
The platform carbonates can be extracted from the volume so that its key features can be described when the 2D Colormap in Paradise makes the non-platform facies transparent (Figure 3a). There are as many as eight SWNE fault bounded segments located by black gaps and one NW-SE frontal segment that extend nearly end to end in this area. The Test location can be seen to be too far downdip to get a good perforation perimeter so the client was encouraged to move it updip as there was no danger of penetrating the unconformity. The only well with productivity information in this facies, #1, has a moderate 38,000 BO (Figure 3b). On the multi-attribute extraction map, its location can be seen to be less than optimal and at the edge of a null zone.
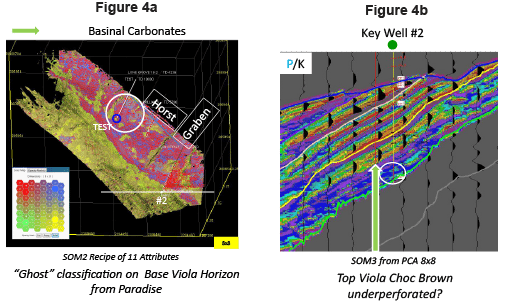
With the basinal carbonates back in view in Figure 4a, one can see the location of the better performing Well #2. In vertical section (Figure 4b), the red highlighted and white-circled perforation zone shows a position on the updip, lapout trap. At 92,595 BO, this well’s productivity from the Viola Chocolate Brown was nearly three times that of the platform carbonates.
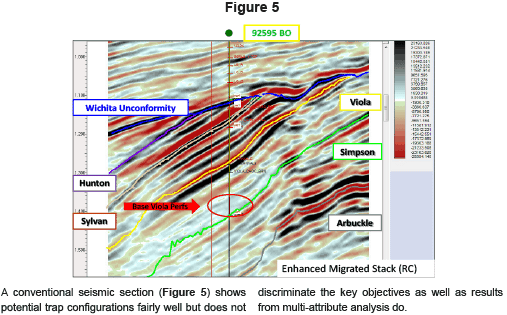
A conventional seismic section (Figure 5) shows potential trap configurations fairly well but does not discriminate the key objectives as well as results from multi-attribute analysis do.
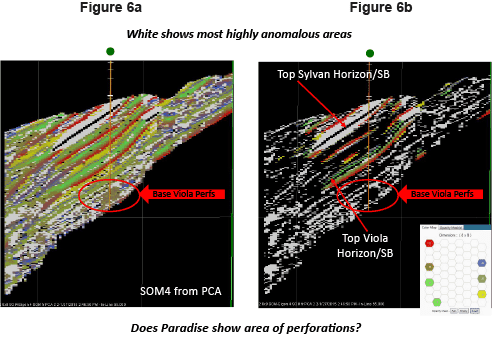
Note that SOM results (Figure 6a and 6b) of the well’s penetration seem to reveal the extent of perforation efficacy in the basinal Viola. Also the low probability facies in white overlay suggest that it is possible that perforation of the upper most Viola Chocolate Brown might have also yielded hydrocarbons.
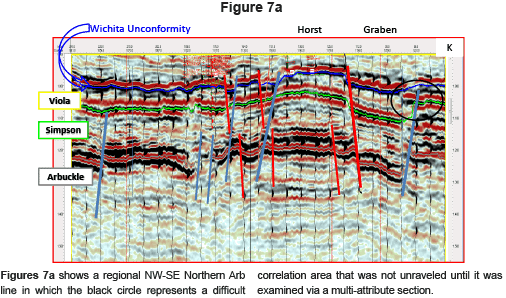
Figures 7a shows a regional NW-SE Northern Arb line in which the black circle represents a difficult correlation area that was not unraveled until it was examined via a multi-attribute section.
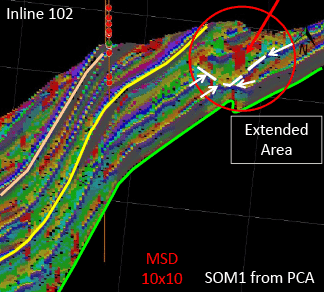
Figure 7b reveals a large karst feature in the updip Viola. Note that the patterns make correlation around the feature straightforward. Our client was very interested in this result because of another play in Kansas. We have also imaged karsts in the Austin Chalk.
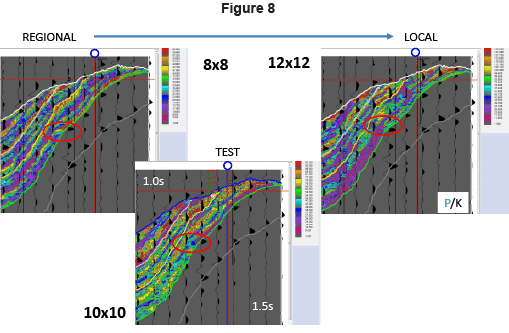
Figure 8 highlights flat spots via red ellipses that represent the facies change from platform to basinal facies. This relationship persists in each of these three topologies, which represent increasing discrimination from 8×8, 10×10, and 12×12. Refer back to Figure 2 at approximately 1.5 seconds for a similar relationship in the Simpson.

