Analysis of Middle Texas Gulf Coast 3D to explore for shallow Yegua Formation Potential
In this case study of the use of Self-Organizing-Maps (SOM analysis), the gathers were used to generate AVO volumes such as Far-Near (used on the angle stacks, where nears were 0-15 degrees and fars were 31-45 degrees), (Far-Near)xFar, Gradient (B), Intercept (A) x Gradient (B), ½(Intercept + Gradient) and Poissons’ Reflectivity (PR).
Conventional amplitude interpretation identified a potential area of hydrocarbon accumulation, downthrown on a down-to-coast fault. Figure 1 is the amplitude extraction from the PSTM-raw volume.
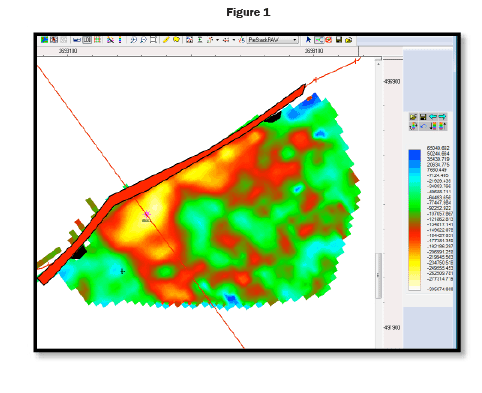
In addition to the created AVO attributes, volumes of Spectral Decomposition, curvature, similarity and other frequency-related attributes were created. Conventional interpretation of the reservoir area indicated the anomaly covered approximately 70 acres.
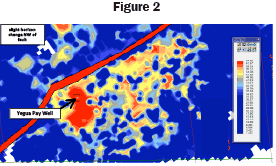
A SOM of the above mentioned AVO attributes, plus Sweetness and Average Energy was run to more closely identify the anomaly and the aerial extent. Figure 2 shows the results of this analysis.
A detailed engineering study of the production indicates that the results of the SOM analysis concur with the aerial extent of the sand deposition to be more in line with almost 400 acres of drainage rather than the initial 70 acres first identified. The SOM identified in this time slice shows a network of sand deposition not seen in conventional mapping.
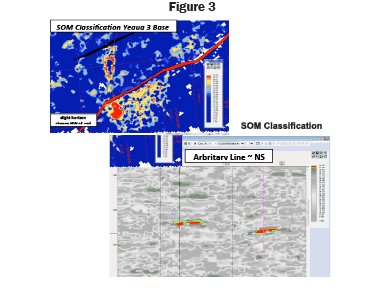
Figure 3 shows an arbitrary line going through a second, upthrown Yegua anomaly identified by the SOM analysis, and now drilled, confirming the economic presence of hydrocarbons.
The conclusion drawn from this study is that SOM analysis proved to complement and enhance the conventional interpretation by providing a second, completely independent method of exposing direct hydrocarbon indicators.


