Attribute Description:
The spectral components generated by the Continuous Wavelet Transform (CWT) are complex time-frequency signals. This type of transform has Morlet wavelets that are proportional to the center frequency. So then, the narrow-band ringing and broad-band impulsive reflections are better positioned in time (Chopra and Marfurt, 2007). The Spectral Magnitude, Spectral Phase, and Spectral Voice attributes are generated at each time-frequency sample. The Spectral Magnitude attribute represents the energy that correlates with the seismic signal (e.g., similar to Envelop), The Spectral Phase attribute denotes the phase rotation between the seismic trace and the modeled Morlet wavelets, the Spectral Voice attribute is the real component of the complex spectrum (e.g., Amplitude) and can be used to enhance the ability of coherence, curvature, or other AASPI structural attribute computations at uncovering thin or small structural and stratigraphic details. On the other hand, the Shape (Ridge) attribute can be used to enhance seismic resolution and reconstructing the seismic trace using broader band wavelets (Davogustto et al., 2013).
Interpretation Use:
The Spectral Magnitude and Spectral Voice attributes can provide detailed subtle stratigraphic information about a reservoir or other zone of interest. Also, these attributes can help at examining geologic features in the form of spectral components. Additionally, the Spectral Phase can provide insights into discontinuity features as well as onlap, offlap, and erosional unconformities. On the other hand, the Spectral Shape (Ridge) attribute can be used to improve the geometry interpretation of geologic features (Chopra and Marfurt, 2007). Attribute results can be analyzed in different ways, from a plan view, vertical transects, or draped over a horizon display.
Recommended Color Palette:
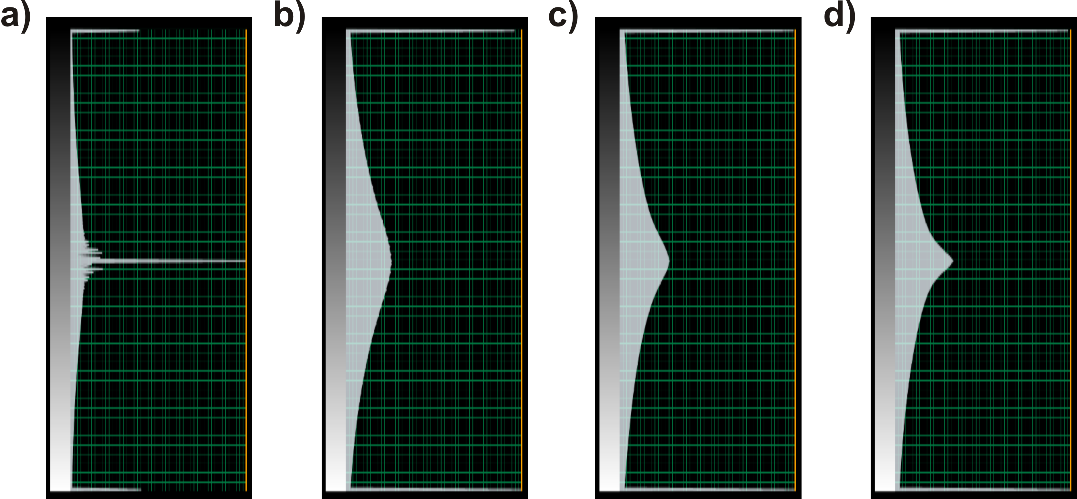
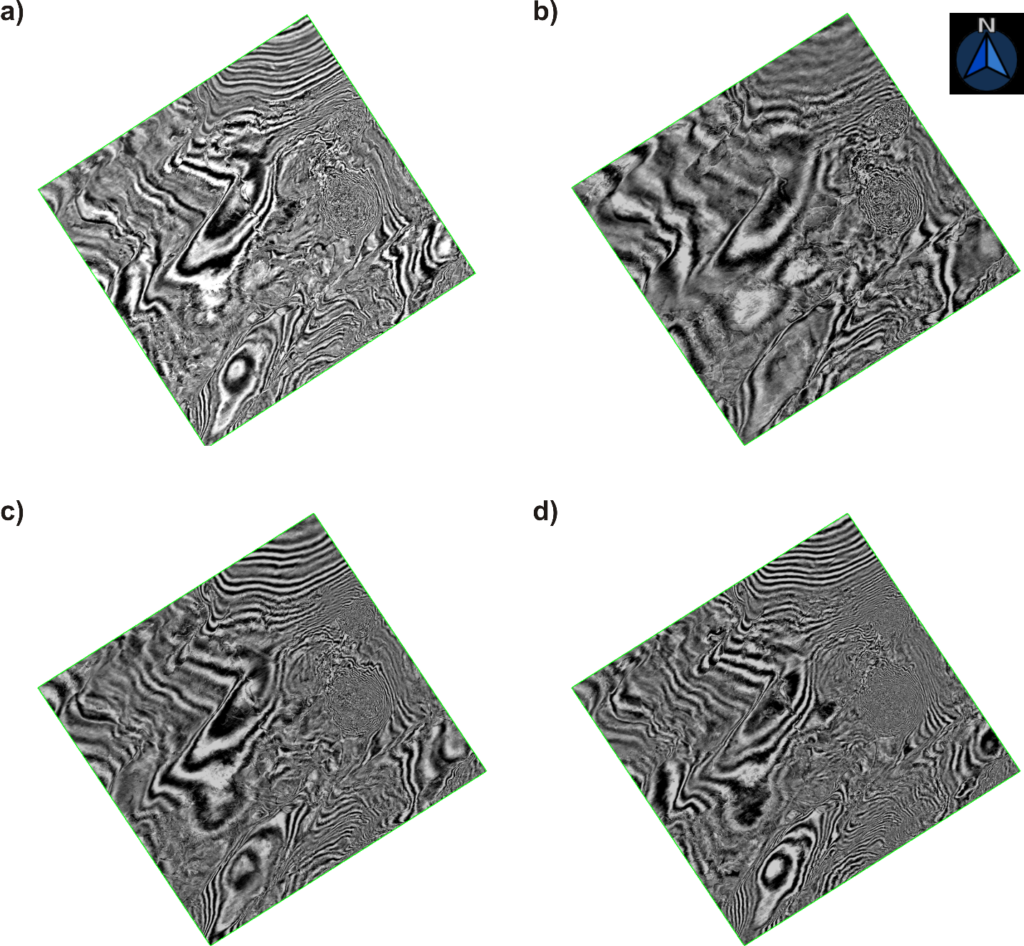
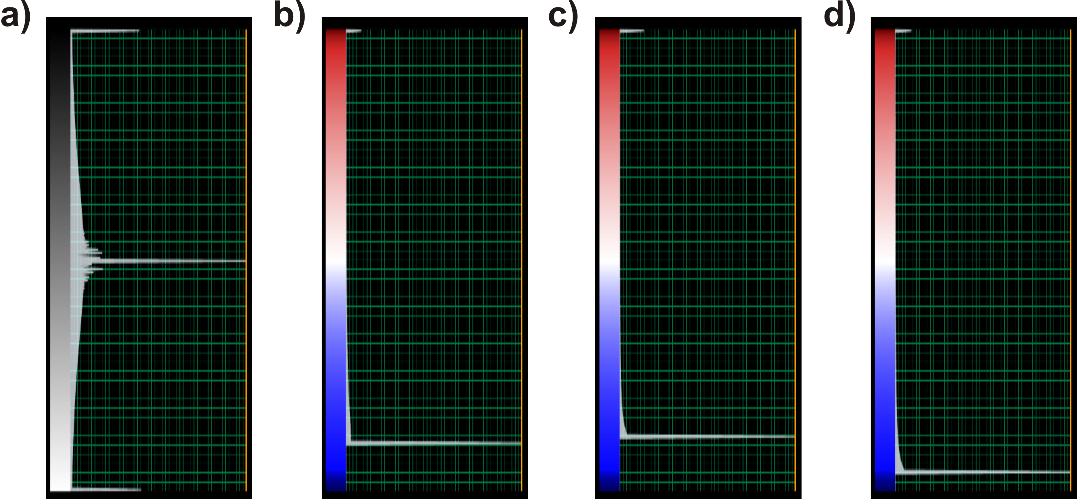
For the Spectral Voice attribute, a grayscale gradient color scheme is suggested. The color progression could begin with white (to highlight useful geological features) and finish with black (to denote shadow areas), or vice-versa. Or any color scheme that works well with normal seismic amplitude data. We suggest using the histogram of values to guide setting color value thresholds.
Figure 1. Color bar examples of seismic amplitude (a) and output attributes: spectral voice 20 Hz (b), spectral voice 32 Hz (c), and spectral voice 44 Hz (d).
Examples:
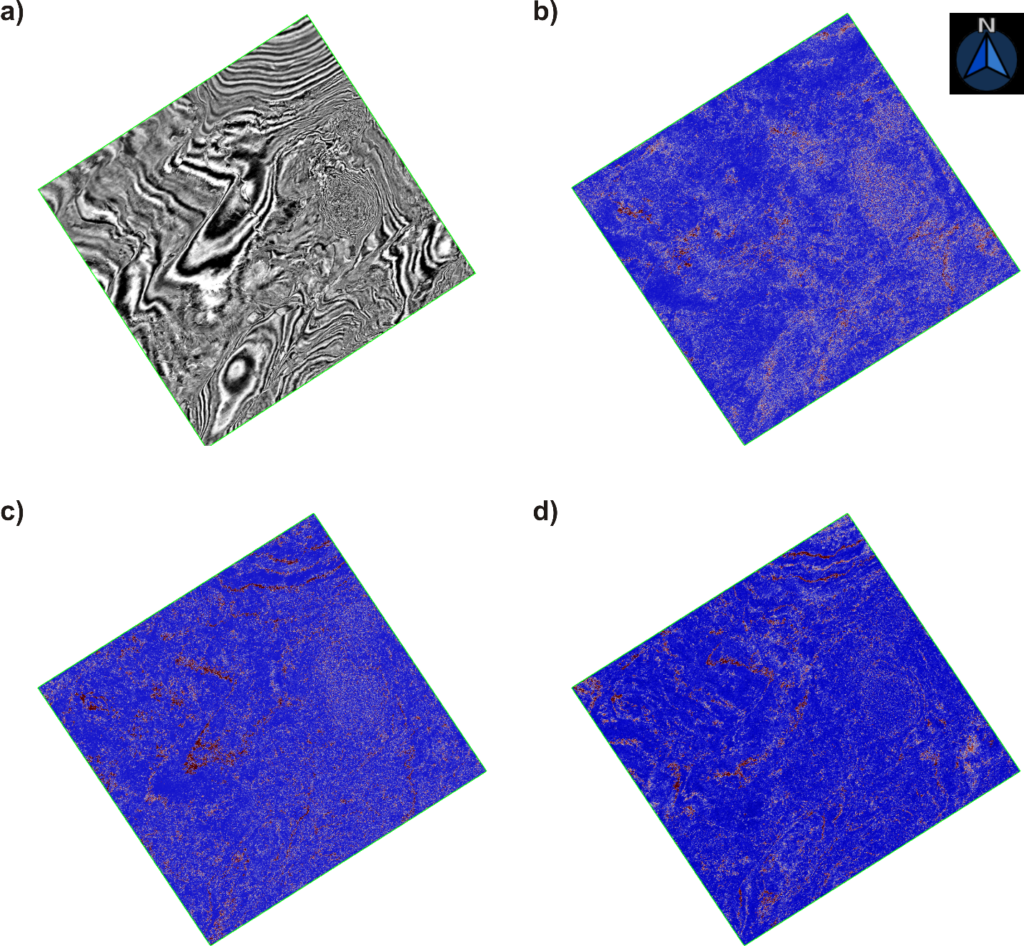
Figure 2. Time slice displays of seismic amplitude (a) and output attribute: spectral voice 20 Hz (b), spectral voice 32 Hz (c), and spectral voice 44 Hz (d).
Recommended Color Palette:
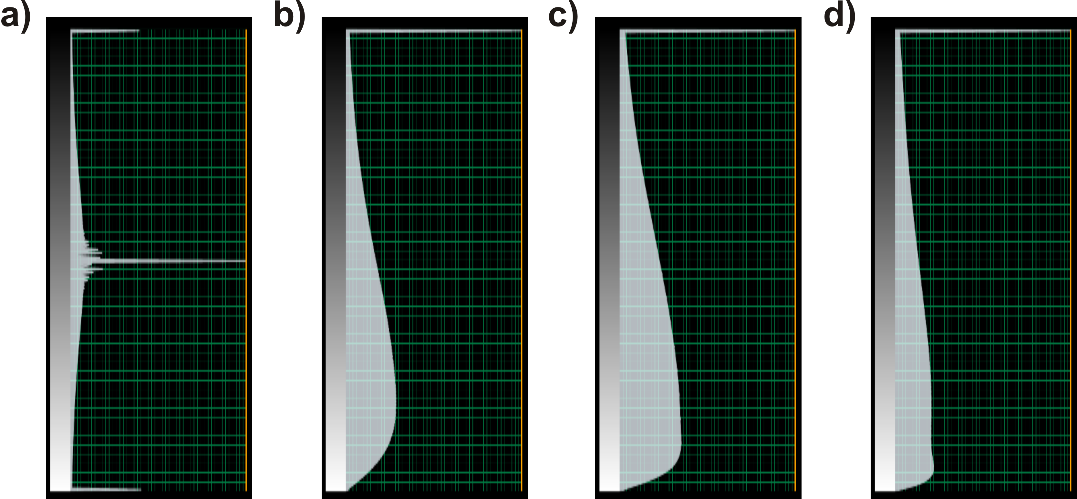
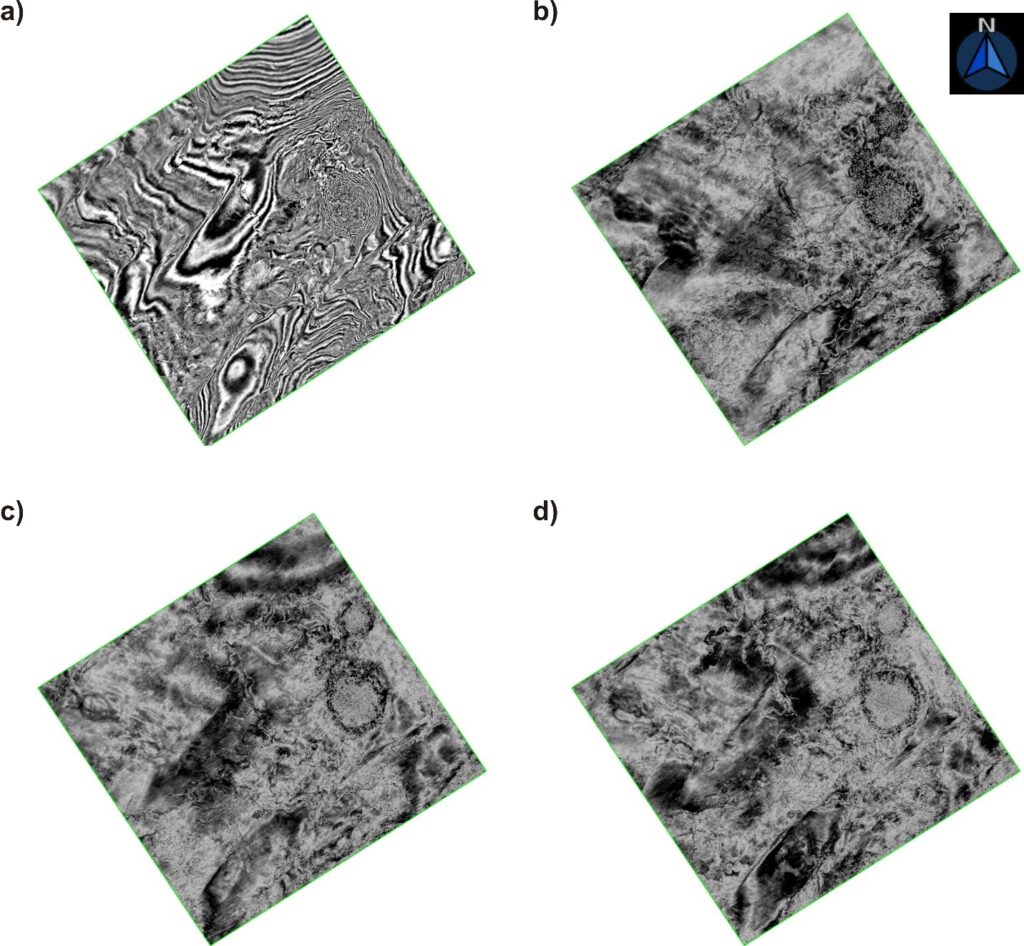
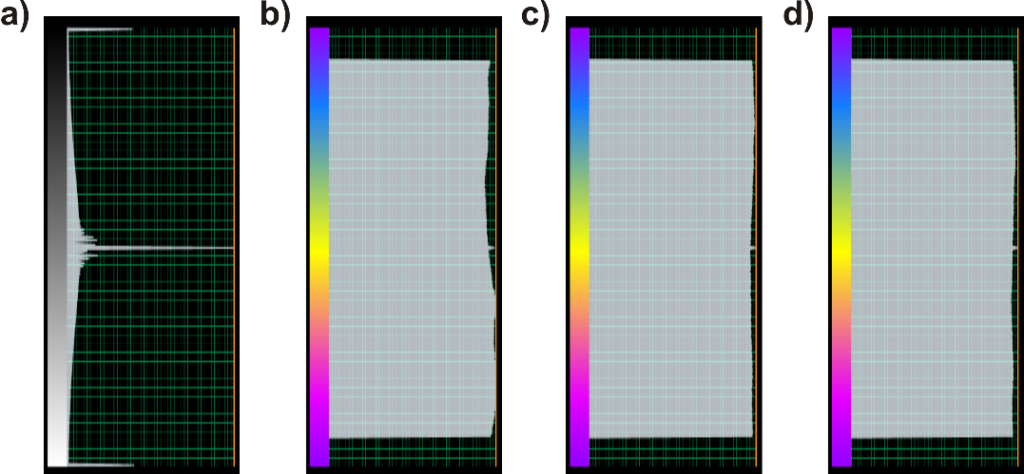
For the Spectral Magnitude attribute, a grayscale gradient color scheme is suggested. The color progression could begin with white (to highlight useful geological features) and finish with black (to denote shadow areas), or vice-versa. We suggest using the histogram of values to guide setting color value thresholds.
Figure 3. Color bar examples of seismic amplitude (a) and output attributes: spectral magnitude 20 Hz (b), spectral magnitude 32 Hz (c), and spectral magnitude 44 Hz (d).
Examples:
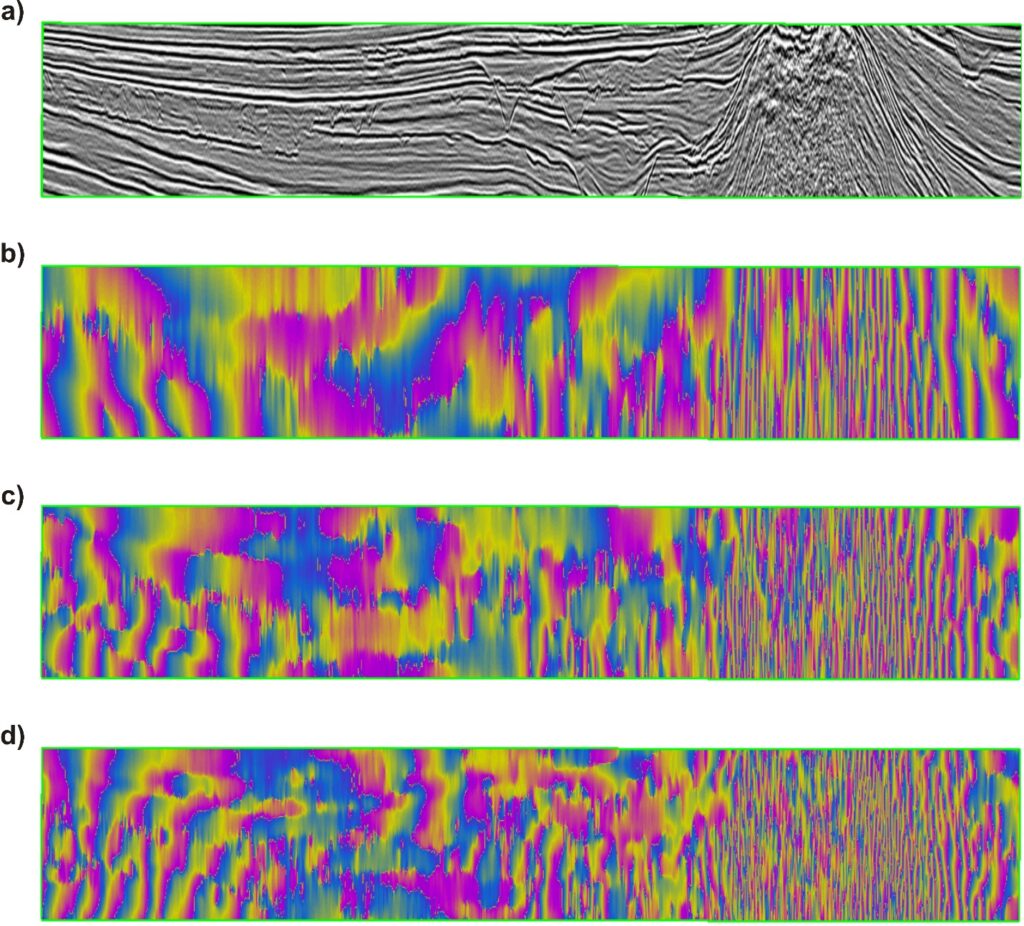
Figure 4. Time slice displays of seismic amplitude (a) and output attributes: spectral magnitude 20 Hz (b), spectral magnitude 32 Hz (c), and spectral magnitude 44 Hz (d).
Recommended color palette:
For the Spectral Shape (Ridge) attribute, a divergent color scheme is suggested. The midpoint color is white to emphasize the progression outward two different dark hues. In the examples below, the dark hues were set to blue and red to better highlight geologic features. We suggest using the histogram of values to guide setting color value thresholds.
Examples:
Recommended color palette:
For the Spectral Phase attribute, a cyclic color scheme is suggested. In this color palette, the hues wrap around so that the red follows purple. A specific color is assigned to different phase ranges, so then the display can be used to infer the continuity of seismic events. We suggest using the histogram of values to guide setting color value thresholds.
Examples:
Computation:
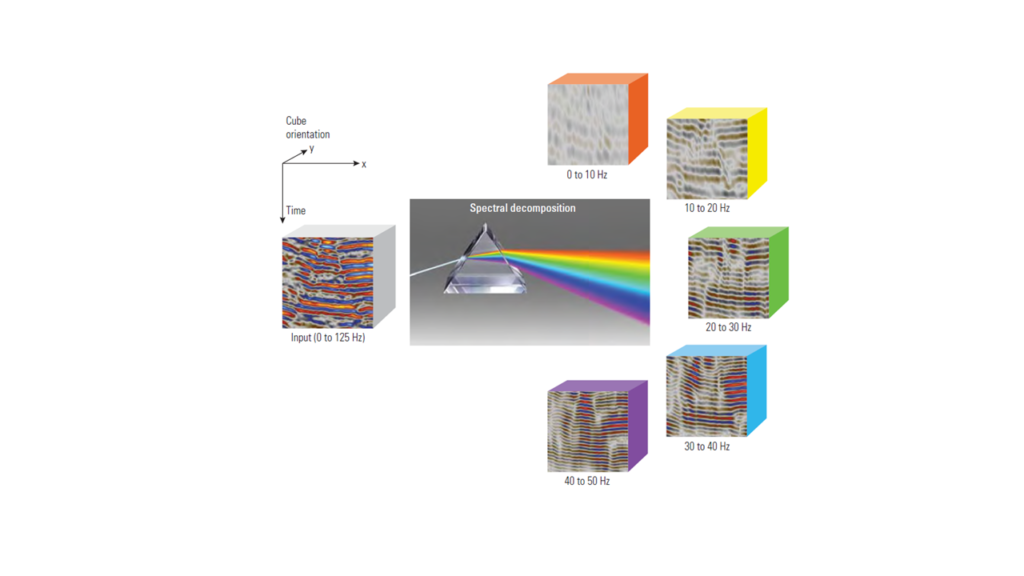
Spectral decomposition can help at illuminating subtle geologic features that are below the resolution of the full frequency seismic data. This method consists of separating seismic signals into different frequency components:
The Spectral Magnitude, Spectral Phase, Spectral Voice, and Spectral Shape (Ridge) attributes are computed using modeled Morlet wavelets. The input amplitude volume (time or depth) is spectrally whitened to account for changes in the source wavelet with depth and a non-flat source spectrum prior to applying the spectral decomposition. The steps involved in computing CWT spectral decomposition are outlined in ASSPI documentation.
The Magnitude Spectral (Eq. 1) and Phase (Eq. 2) Spectral attributes are given by:
where v(t,f) and vH(t,f) are the real and imaginary part of the complex spectrum (Figure 1). Note that the Phase Spectral attribute ranges between -180° and +180°. Then, the Voice Spectral attribute is given by Voice(t,f) = v(t,f) (Chopra and Marfurt, 2016).
References
- AASPI documentation, http://mcee.ou.edu/aaspi/documentation/Spectral_Attributes-spec_cwt.pdf
- Aarre, V., t. N. A. Al Dayyni, S. L. Mahmoud, A. B. S. Clark, B. Toelle, O. V. Vejbaek, and G. White, 2012, Seismic detection of subtle faults and fractures: Oilfields Review Summer, 24, 28 – 43.
- Chopra, S. and K. J. Marfurt, 2007, Seismic attributes for prospect identification and reservoir characterization: SEG Geophysical development series, 11, 123 – 151.
- Chopra, S. and K. J. Marfurt, 2016, Spectral decomposition and spectral balancing of seismic data: The Leading Edge, 35, 176 – 179.
- Davogustto, O., M. C. de Matos, C. Cabarcas, T. Dao, K. J. Marfurt, 2013, Resolving subtle stratigraphic features using spectral ridges and phase residues: Interpretation, 1, SA93 – SA108.

