Attribute Description:
Spec_max_entropy is a maximum entropy implementation of the short time Fourier transform (STFT). This program reconstructs the signal by using simple sines and cosines whose period can exceed that of the analysis window. The goal is to fit the data with minimum number of sines and cosines. This algorithm provides a time-frequency analysis with a combination of time and frequency resolution superior to the STFT and continuous wavelet transform. This algorithm also provides better temporal resolution than the continuous wavelet transforms, particular at low frequency, and avoid certain degrees of spectral smearing which appears in the conventional STFT.
Three types of data are produced: The Spectral Voice, Spectral Magnitude, and Spectral Phase. The Spectral Magnitude attribute represents the energy that correlates with the seismic signal (e.g., similar to Envelop), the Spectral Phase attribute denotes the phase at the sample and the frequency, and the Spectral Voice attribute corresponds to the real component of complex spectrum (e.g., Amplitude) and can be further used to calculate similarity, curvatures or other AASPI structural attributes to uncover thin or small structural and stratigraphic details.
Interpretation Use:
The Spectral Magnitude and Spectral Voice attributes can provide detailed stratigraphic information about a reservoir or other zones of interest. Also, these attributes can help examining geologic features in the form of spectral components. Additionally, the Spectral Phase can provide insights into discontinuity features as well as onlap, offlap, and erosional unconformities.
Recommended Color Palette:
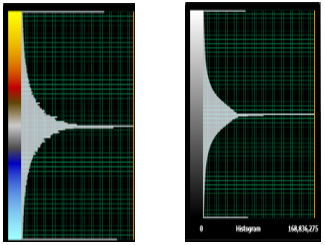
For Spectral Voice attributes, it is recommended to use a grayscale gradient color scheme or any dual-polarity colorbar that suits regular seismic amplitude data.
Figure 1. Colorbar example for Voice Component
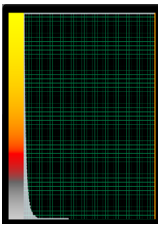
For Spectral Magnitude Attributes, background color scheme is set to gray. The higher magnitude values are marked with gradational colors between yellow and red.
Figure 2. Colorbar example for Magnitude Component
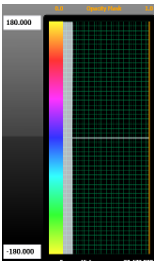
For Spectral Phase Attributes, the colorbar should reflect the cyclic nature of the phase range from -180 to 180 degrees.
Figure 3. Colorbar example for Phase Component
Examples:
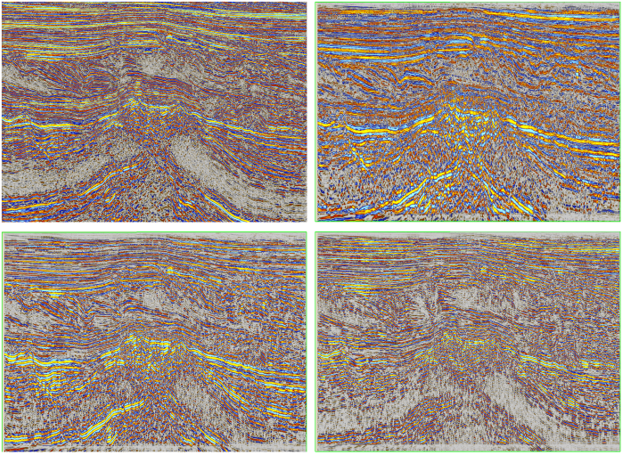
Figure 4. Amplitude volume (upper-left), 10 Hz Voice volume (upper-right), 20 Hz Voice volume (lower-left) and 30 Hz Voice volume (lower-right), displayed on crossline 2000 from 0.5-3 second from Kora 3D survey, NZ.
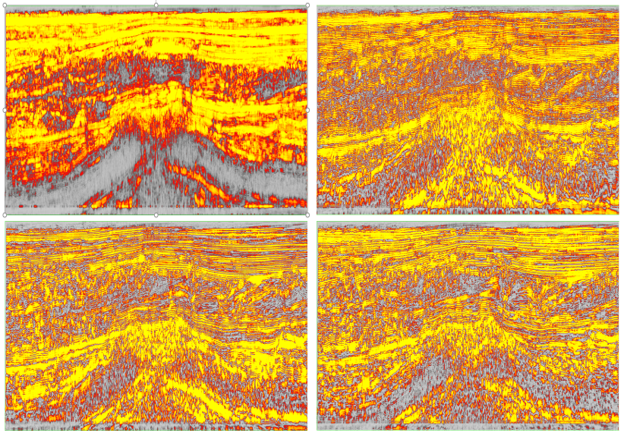
Figure 5. Peak Magnitude volume (upper-left), 10 Hz Magnitude volume (upper-right), 20 Hz Magnitude volume (lower-left) and 30 Hz Magnitude volume (lower-right), displayed on crossline 2000 from 0.5-3 second from Kora 3D survey, NZ.
Figure 6: Peak Phase volume (upper-left), 10 Hz Phase volume (upper-right), 20 Hz Phase volume (lower-left) and 30 Hz Phase volume (lower-right), displayed on crossline 2000 from 0.5-3 second from Kora 3D survey, NZ.
References
- AASPI online documents: http://mcee.ou.edu/aaspi/documentation/Spectral_Attributes-spec_max_entropy.pdf
- Puryear C. I., O. N. Portniaguine, C. M. Cobos, and J. P. Castagna, 2012, Constrained least-squares spectral analysis: Application to seismic data. Geophysics, 77, V143–V167.

