By Rocky Roden, Geophysical Insights, and Deborah Sacrey, Auburn Energy | Published with permission: GeoExPro Magazine, Vol.13, No. 6 | December 2016
Abstract
Today’s seismic interpreters must deal with enormous amounts of information, or ‘Big Data’, including seismic gathers, regional 3D surveys with numerous processing versions, large populations of wells and associated data, and dozens if not hundreds of seismic attributes that routinely produce terabytes of data. Machine learning has evolved to handle Big Data. This incorporates the use of computer algorithms that iteratively learn from the data and independently adapt to produce reliable, repeatable results. Multi-attribute analyses employing principal component analysis (PCA) and self-organizing maps are components of a machine-learning interpretation workflow (Figure 1) that involves the selection of appropriate seismic attributes and the application of these attributes in an unsupervised neural network analysis, also known as a self-organizing map, or SOM. This identifies the natural clustering and patterns in the data and has been beneficial in defining stratigraphy, seismic facies, DHI features, sweet spots for shale plays, and thin beds, to name just a few successes. Employing these approaches and visualizing SOM results utilizing 2D color maps reveal geologic features not previously identified or easily interpreted from conventional seismic data.
Steps 1 and 2: Defining Geologic Problems and Multiple Attributes
Seismic attributes are any measurable property of seismic data and are produced to help enhance or quantify features of interpretation interest. There are hundreds of types of seismic attributes and interpreters routinely wrestle with evaluating these volumes efficiently and strive to understand how they relate to each other.

The first step in a multi-attribute machine-learning interpretation workflow is the identification of the problem to resolve by the geoscientist. This is important because depending on the interpretation objective (facies, stratigraphy, bed thickness, DHIs, etc.), the appropriate set of attributes must be chosen. If it is unclear which attributes to select, a principal component analysis (PCA) may be beneficial. This is a linear mathematical technique to reduce a large set of variables (seismic attributes) to a smaller set that still contains most of the variation of independent information in the larger dataset. In other words, PCA helps determine the most meaningful seismic attributes.
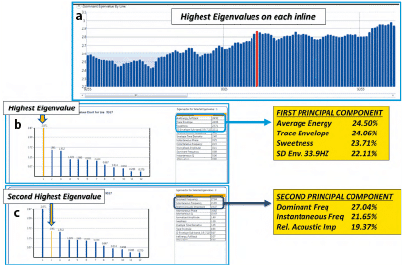
Figure 2 is a PCA analysis from Paradise® software by Geophysical Insights, where 12 instantaneous attributes were input over a window encompassing a reservoir of interest. The following figures also include images of results from Paradise. Each bar in Figure 2a denotes the highest eigenvalue on the inlines in this survey. An eigenvalue is a value showing how much variance there is in its associated eigenvector and an eigenvector is a direction showing a principal spread of attribute variance in the data. The PCA results from the selected red bar in Figure 2a are denoted in Figures 2b and 2c. Figure 2b shows the principal components from the selected inline over the zone of interest with the highest eigenvalue (first principal component) indicating the seismic attributes contributing to this largest variation in the data. The percentage contribution of each attribute to the first principal component is designated. In this case the top four seismic attributes represent over 94% of the variance of all the attributes employed. These four attributes are good candidates to be employed in a SOM analysis. Figure 2c displays the percentage contribution of the attributes for the second principal component. The top three attributes contribute over 68% to the second principal component. PCA is a measure of the variance of the data, but it is up to the interpreter to determine and evaluate how the results and associated contributing attributes relate to the geology and the problem to be resolved.
Steps 3 and 4: SOM Analysis and Interpretation
The next step in the multi-attribute interpretation process requires pattern recognition and classification of the often subtle information embedded in the seismic attributes. Taking advantage of today’s computing technology, visualization techniques, and understanding of appropriate parameters, self-organizing maps, developed by Teuvo Kohonen in 1982, efficiently distill multiple seismic attributes into classification and probability volumes. SOM is a powerful non-linear cluster analysis and pattern recognition approach that helps interpreters identify patterns in their data, some of which can relate to desired geologic characteristics. The tremendous amount of samples from numerous seismic attributes exhibit significant organizational structure. SOM analysis identifies these natural organizational structures in the form of natural attribute clusters. These clusters reveal significant information about the classification structure of natural groups that is difficult to view any other way.
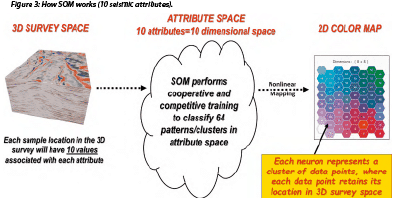
Figure 3 describes the SOM process used to identify geologic features in a multi-attribute machine-learning methodology. In this case, 10 attributes were selected to run in a SOM analysis over a specific 3D survey, which means that 10 volumes of different attributes are input into the process. All the values from every sample from the survey are input into attribute space where the values are normalized or standardized to the same scale. The interpreter selects the number of patterns or clusters to be delineated. In the example in Figure 3, 64 patterns are to be determined and are designated by 64 neurons. After the SOM analysis, the results are nonlinearly mapped to a 2D color map which shows 64 neurons.
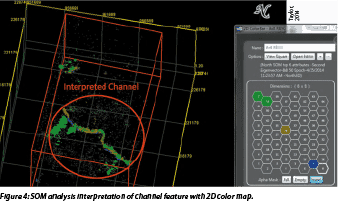
At this point, the interpreter evaluates which neurons and associated patterns in 3D space define features of interest. Figure 4 displays the SOM results, where four neurons have highlighted not only a channel system but details within that channel. The next step is to refine the interpretation and perhaps use different combinations of attributes and/or use different neuron counts. For example, in Figure 4, to better define details in the channel system may require increasing the neuron count to 100 or more neurons to produce much more detail. The scale of the geologic feature of interest is related to the number of neurons employed; low neuron counts will reveal larger scale features, whereas a high neuron count defines much more detail.
Workflow Examples
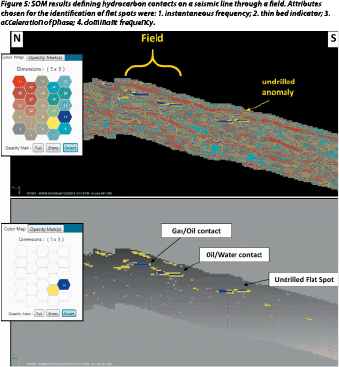
Figure 5 shows the SOM classification from an offshore Class 3 AVO setting where direct hydrocarbon indicators (DHIs) should be prevalent. The four attributes listed for this SOM run were selected from the second principal component in a PCA analysis. This SOM analysis clearly identified flat spots associated with a gas/oil and an oil/water contact. Figure 5 displays a line through the middle of a field where the SOM classification identified these contacts, which were verified by well control. The upper profile indicates that 25 neurons were employed to identify 25 patterns in the data. The lower profile indicates that only two neurons are identifying the patterns associated with the hydrocarbon contacts (flat spots). These hydrocarbon contacts were difficult to interpret with conventional amplitude data.
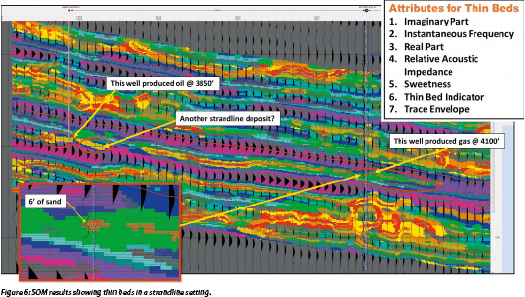
The profile in Figure 6 displays a SOM classification where the colors represent individual neurons with a wiggle-trace variable area overlay of the conventional amplitude data. This play relates to a series of thin strandline sand deposits. These sands are located in a very weak trough on the conventional amplitude data and essentially have no amplitude expression. The SOM classification employed seven seismic attributes which were determined from the PCA analysis. A 10×10 matrix of neurons or 100 neurons were employed for this SOM classification. The downdip well produced gas from a 6’ thick sand that confirmed the anomaly associated with a dark brown neuron from the SOM analysis. The inset for this sand indicates that the SOM analysis has identified this thin sand down to a single sample size which is 1 ms (5’) for this data. The updip well on the profile in Figure 6 shows a thin oil sand (~6’ thick) that is associated with a lighter brown neuron with another possible strandline sand slightly downdip. This SOM classification defines very thin beds and employs several instantaneous seismic attributes that are measuring energy in time and space outside the realm of conventional amplitude data.
Geology Defined
The implementation of a multi-attribute machine-learning analysis is not restricted to any geologic environment or setting. SOM classifications have been employed successfully both onshore and offshore, in hard rocks and soft rocks, in shales, sands, and carbonates, and as demonstrated above, for DHIs and thin beds. The major limitations are the seismic attributes selected and their inherent data quality. SOM is a non-linear classifier and takes advantage of finely sampled data and is not burdened by typical amplitude resolution limitations. This machine learning seismic interpretation approach has been very successful in distilling numerous attributes to identify geologic objectives and has provided the interpreter with a methodology to deal with Big Data.


