Prior to the analysis described in this and the related three Application Briefs (EF-1, EF-2, and EF-4), the client believed that the faults were not well resolved within the Eagle Ford on the base “amplitude” seismic survey or on views of a single similarity attribute. This brief demonstrates that faults can be readily resolved via analysis of multiple attributes simultaneously.
Principal Component Analysis in Paradise® was used initially to reduce an initial set of 25 geometric attributes to ten from the first two Eigenvectors. Five similarity attributes, which included Chaotic Reflection, Dip of maximum Similarity, Similarity, Smoothed Dip of Maximum Similarity and Smoothed Similarity, contributed the greatest variance to the result set according to the first Eigenvector. Curvature in the Dip and Strike Directions, Maximum Curvature, Mean Curvature, and Shape Index contributed the most variance within the second Eigenvector. For setting up the input to the Self Organizing Map (SOM) process, a recommended work process uses the most prominent 2-5 attributes that contribute the greatest variance among each of the largest Eigenvectors which may number 1-4 or 5. The combined contribution for the select set of attributes should comprise at least a cumulative 60% of the variance within the region of the PCA analysis.
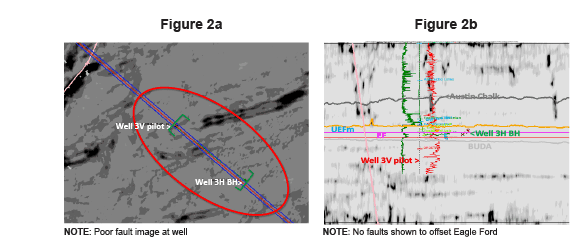
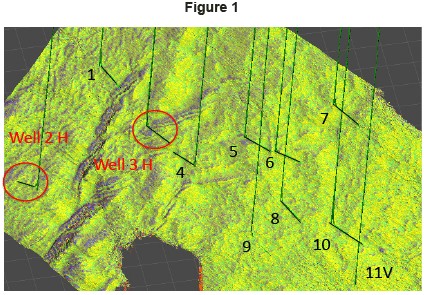
A result illustrated in Figure 1 is from a geometric SOM made from these ten attributes visualized as a “ghost” on the Top Eagle Ford horizon, which has then been pushed down into the High Resistivity Eagle Ford shale objective. The multiplicity of faults that can now be seen defied expectations. Well 3H’s borehole encounter of six faults while drilling, which can be individually seen here, could not have been anticipated from the use of a single similarity attribute display such as Figures 2a and 2b.
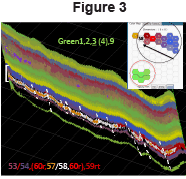
Figure 3 shows results from the same Instantaneous SOM with the 2D Colormap formerly seen in Figure 2 in Paradise Application Brief EF-2 (PAB EF2). The figure is from an inline that transects the downdip portion of the geobody also shown there. The patterns seen in the neuron textures now reveal details in the structure of that body in the vertical section. Numerous faults, including many that are compressional in nature, can be interpreted that were not evident at all in the original seismic data.
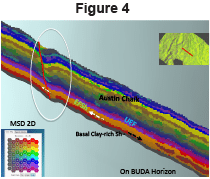
Figure 4 shows a close-up of a single compressional fault with remarkable detail in the offset in the Eagle Ford shale. For this view, the favored 2D Colormap for an 8×8 topology, i.e., 64 neurons, called Map Shade Dark, is in use (see also Figure 1b in PAB EF2). Onlap of high resistivity greyish-gold facies are connoted by white left arrows. An underlying double red downlap is located by the black right arrow. Note that the former is evident as fill in the parting of the latter at the fault in the Eagle Ford. Offset is actually most subtle here in the Upper Eagle Ford marl.
All seismic data owned and provided courtesy of Seitel, Inc.


