This and three companion Application Briefs (EF2, EF-3, and EF-4) present details of an analysis and results from the application of Paradise® on a large 3D seismic volume from two counties in Texas focused on the Eagle Ford trend and its bounding formations: the underlying Buda and the overlying Austin Chalk. The results characterize remarkable resolution of stratigraphic and structural details in these three formations. Dramatically, these Application Briefs will show resolution of
features below seismic resolution, a product of the analysis taking full advantage of multiple attributes simultaneously.
While this and related Application Briefs are set in unconventional geologies, the principles outlined herein are applicable to both conventional and unconventional resource plays.
The analysis began by applying Principal Component Analysis (PCA) on 16 Instantaneous attributes. Instantaneous attributes calculate a value at each sample and inherently return higher frequency information. From the PCA analysis, nine attributes were run in Self-Organizing Maps (SOMs) and, of these, five were found to be most common in the Eagle Ford results. A brief description of the five types of Instantaneous attributes is as follows:
- Instantaneous Phase for the continuity/ discontinuity enhancement;
- Normalized Amplitude aka Cosine of Instantaneous Phase returns the energy distinctly from peaks versus troughs;
- Relative Acoustic Impedance helps to resolve geobodies;
- Envelope or Total Energy of the entire reflected waveform, including Real Part of the reflected seismic that is measurable and the Imaginary Part which is not.
- Separately, Trace Envelope was found to be applicable in one unusual setting and facies tract for geobody 2, and suggests another distinction in rock or reservoir type.
Figure 1

In addition to the above, Envelope 2nd Derivative, Instantaneous Frequency, and Thin Bed Indicator rounded out the nine suggested by the PCA. However, these three were less evident in the area investigated or were possibly in the background.
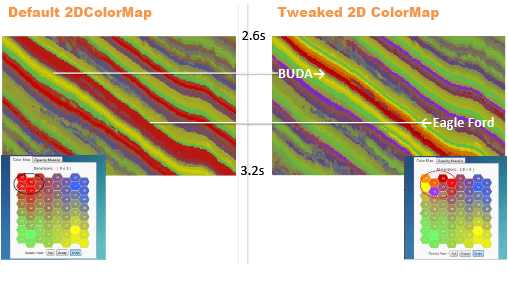
The original PCA and SOM were run over a 1.5 to 3.2 sec. interval and a specific range of inlines and crosslines to capture the Eagle Ford’s complete updip to downdip occurrence. Results were first viewed by use of the default Interactive 2D Colormap (Figure 1a), which is unique to Paradise. Note that the Eagle Ford is resolved but not uniquely distinguished until a few colors that were not specific to the Eagle Ford were changed in the Interactive 2D Colormap. Figure 1b shows the result that helped confirm the near-uniqueness of the Eagle Ford facies in the stratigraphy of the area.
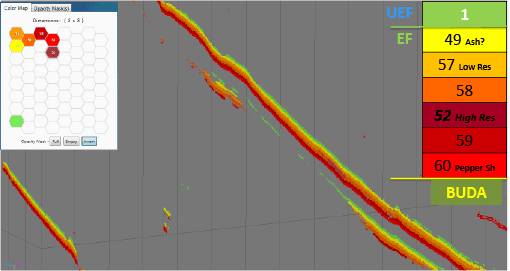
The transparency function of the interactive 2D Colormap was then used to remove all neuron colors except those that represent the Eagle Ford shale and the overlying interface with the Upper Eagle Ford marl. This technique exposed other similar and sizeable objectives in the overall stratigraphic section. Figure 2 reveals that filled scour structures carved into the top of the Georgetown and an uncalibrated zone, possibly Pearsall, share the facies characteristics of the Eagle Ford, which suggest these other formations also likely include similar organic-rich shale facies.
Figure 2
All seismic data owned and provided courtesy of Seitel, Inc.


