By Rocky Roden, Geophysical Insights | Published with permission: Offshore Technology Conference | May 2015
Abstract
The generation of seismic attributes has enabled geoscientists to better understand certain geologic features in their seismic data. Seismic attributes are a measurable property of seismic data, such as amplitude, dip, frequency, phase and polarity. Attributes can be measured at one instant in time/depth or over a time/depth window, and may be measured on a single trace, on a set of traces, or on a surface interpreted from the seismic data. Commonly employed categories of seismic attributes include instantaneous, AVO, spectral decomposition, inversion, geometric and amplitude accentuating. However, the industry abounds with dozens, if not hundreds, of seismic attributes that at times are difficult to understand and not all have interpretive significance. Over the last few years there have been efforts to distill these numerous seismic attributes into volumes that can be easily evaluated to determine their geologic significance and improve seismic interpretations. With increased computer power and research that has determined appropriate parameters, self-organizing maps (SOM), a form of unsupervised neural networks, has proven to be an excellent method to take many of these seismic attributes and produce meaningful and easily interpretable results. SOM analysis reveals the natural clustering and patterns in the data and has been beneficial in defining stratigraphy, seismic facies (pressure), DHI features, and sweet spots for shale plays. Recent work utilizing SOM, along with principal component analysis (PCA), has revealed geologic features not identified or easily interpreted previously from the data. The ultimate goal in this multiattribute analysis is to enable the geoscientist to produce a more accurate interpretation and reduce exploration and development risk.
Introduction
The object of seismic interpretation is to extract all the geological information possible from the data as it relates to structure, stratigraphy, rock properties, and perhaps reservoir fluid changes in space and time (Liner, 1999). Over the last two decades the industry has seen significant advancements in interpretation capabilities, strongly driven by increased computer power and associated visualization technology. Advanced picking and tracking algorithms for horizons and faults, integration of pre-stack and post-stack seismic data, detailed mapping capabilities, integration of well data, development of geological models, seismic analysis and fluid modeling, and generation of seismic attributes are all part of the seismic interpreter’s toolkit. What is the next advancement in seismic interpretation?
A significant issue in today’s interpretation environment is the enormous amount of data that is employed and generated in and for our workstations. Seismic gathers, regional 3D surveys with numerous processing versions, large populations of wells and associated data, and dozens if not hundreds of seismic attributes that routinely produce quantities of data in the terabytes. The ability for the interpreter to make meaningful interpretations from these huge projects can be difficult and at times quite inefficient. Is the next step in the advancement of interpretation the ability to interpret large quantities of seismic data more effectively and potentially derive more meaningful information from the data?
This paper describes the methodologies to analyze combinations of seismic attributes for meaningful patterns that correspond to geological features. A seismic attribute is any measurable property of seismic data, such as amplitude, dip, phase, frequency, and polarity and can be measured at one instant in time/depth over a time/depth window, on a single trace, on a set of traces, or on a surface interpreted from the seismic data (Schlumberger Oil Field Dictionary). Seismic attributes reveal features, relationships, and patterns in the seismic data that otherwise might not be noticed (Chopra and Marfurt, 2007). Therefore, it is only logical to deduce that a multi-attribute approach with the proper input parameters can produce even more meaningful results and help reduce risk in prospects and projects. Principal Component Analysis (PCA) and Self-Organizing Maps (SOM) provide multi-attribute analyses that have proven to be an excellent pattern recognition approach in the seismic interpretation workflow.
Seismic Attributes
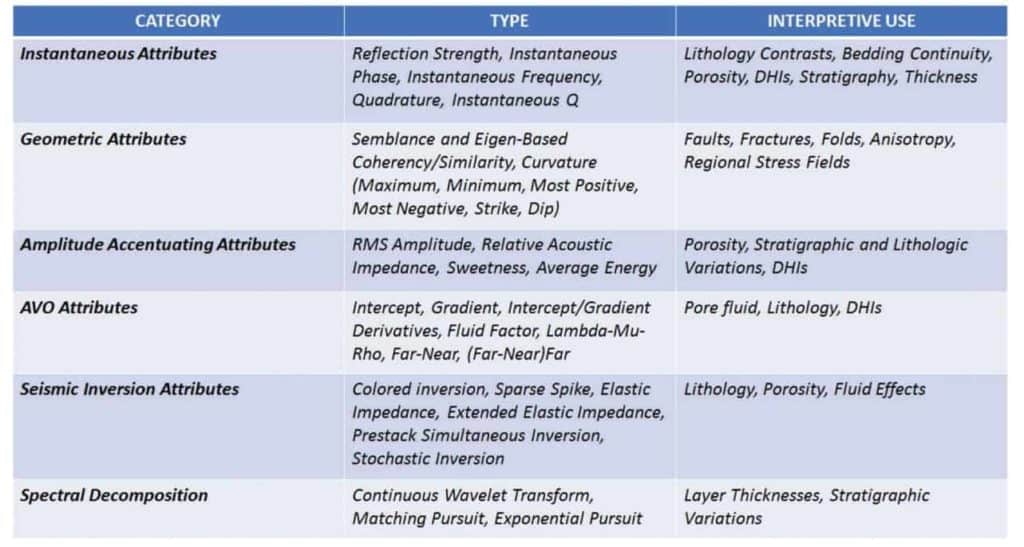
Balch (1971) and Anstey at Seiscom-Delta in the early 1970’s are credited with producing some of the first generation of seismic attributes and stimulated the industry to rethink standard methodology when these results were presented in color. Further development was advanced with the publications by Taner and Sheriff (1977) and Taner et al. (1979) who presented complex trace attributes to display aspects of seismic data in color not seen before, at least in the interpretation community. The primary complex trace attributes including reflection strength (envelope), instantaneous phase, and instantaneous frequency inspired several generations of new seismic attributes that evolved as our visualization and computer power improved. Since the 1970’s there has been an explosion of seismic attributes to such an extent that there is not a standard approach to categorize these attributes. Table 1 is a composite list of seismic attributes and associated categories routinely employed in seismic interpretation today. There are of course many more seismic attributes and combinations of seismic attributes than listed in Table 1, but as Barnes (2006) suggests, if you don’t know what an attribute means or is used for, discard it. Barnes prefers attributes with geological or geophysical significance and avoids attributes with purely mathematical meaning.
In an effort to improve interpretation of seismic attributes, interpreters began to co-blend two and three attributes together to better visualize features of interest. Even the generation of attributes on attributes has been employed. Abele and Roden (2012) describe an example of this where dip of maximum similarity, a type of coherency, was generated for two spectral decomposition volumes (high and low bands) which displayed high energy at certain frequencies in the Eagle Ford Shale interval of South Texas. The similarity results at the Eagle Ford from the high frequency data showed more detail of fault and fracture trends than the similarity volume of the full frequency data. Even the low frequency similarity results displayed better regional trends than the original full frequency data. From the evolution of ever more seismic attributes that multiply the information to interpret, we investigate principal component analysis and self-organizing maps to derive more useful information from multi-attribute data in the search for oil and gas.
Principal Component Analysis
The first step in a seismic multi-attribute analysis is to determine which seismic attributes to select for the SOM. Interpreters familiar with seismic attributes and what they reveal (see Table 1) in their geologic setting may select a group of attributes and run a SOM. If it is unclear which attributes to select, a principal component analysis (PCA) may be beneficial. PCA is a linear mathematical technique to reduce a large set of variables (seismic attributes) to a small set that still contains most of the variation in the large set.
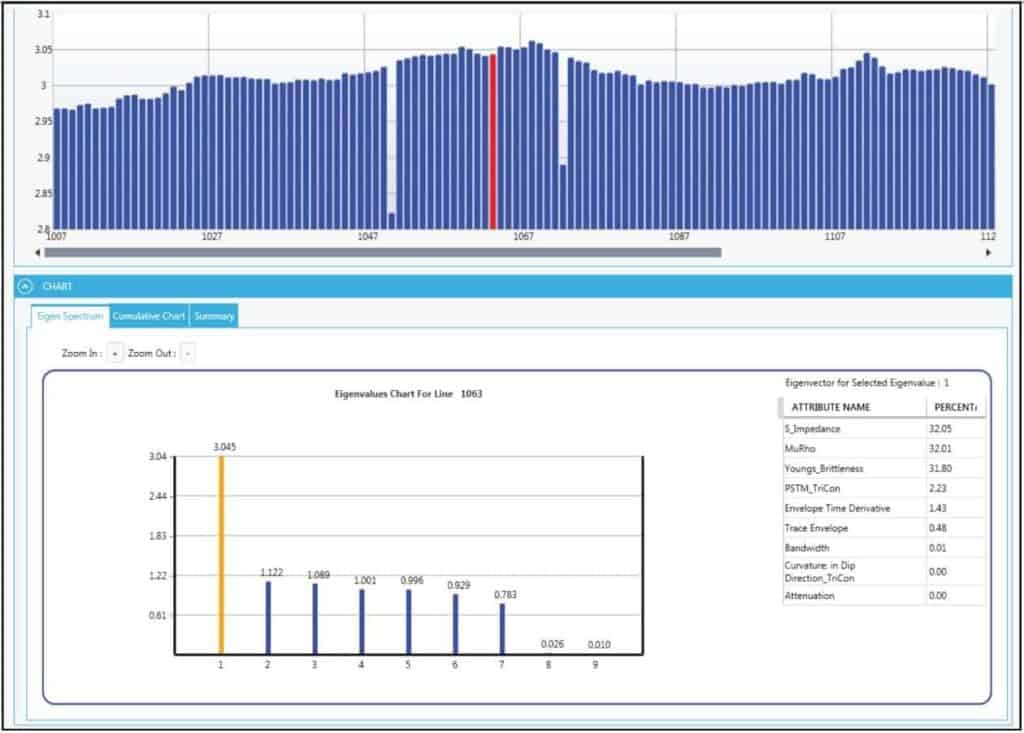
In other words, to find the most meaningful seismic attributes. Figure 1 displays a PCA analysis where the blue histograms on top show the highest eigenvalues for every inline in that seismic survey. An eigenvalue is the value showing how much variance there is in its associated eigenvector and an eigenvector is the direction showing the spread in the data. An interpreter is looking for what seismic attributes make up the highest eigenvalues to determine appropriate seismic attributes to input into a SOM run. The selected eigenvalue (in red) on the top of Figure 1 is expanded by showing all eigenvalues (largest to smallest left to right) on the lower leftmost portion of the figure. Seismic attributes for the largest eigenvector show their contribution to the largest variance in the data. In this example S impedance, MuRho, and Young’s brittleness make up over 95% of the highest eigenvalue. This suggests these three attributes show significant variance in the overall set of nine attributes employed in this PCA analysis and may be important attributes to employ in a SOM analysis. Several highest-ranking attributes of the highest and perhaps the second highest eigenvalues are evaluated to determine the consistency in the seismic attributes contributing to the PCA. This process enables the interpreter to determine appropriate seismic attributes for the SOM evaluation.
Self-Organizing Maps
The next level of interpretation requires pattern recognition and classification of this often subtle information embedded in the seismic attributes. Taking advantage of today’s computing technology, visualization techniques, and understanding of appropriate parameters, Self-Organizing Maps (SOMs) (Kohonen, 2001) efficiently distills multiple seismic attributes into classification and probability volumes (Smith and Taner, 2010). SOM is a powerful non-linear cluster analysis and pattern recognition approach that helps interpreters identify patterns in their data that can relate to desired geologic characteristics as listed in Table 1. Seismic data contains huge amounts of data samples, is highly continuous, greatly redundant, and significantly noisy (Coleou et al., 2003). The tremendous amount of samples from numerous seismic attributes exhibit significant organizational structure in the midst of noise (Taner, Treitel, and Smith, 2009). SOM analysis identifies these natural organizational structures in the form of clusters. These clusters reveal significant information about the classification structure of natural groups that is difficult to view any other way. The natural groups and patterns in the data identified by clusters reveal the geology and aspects of the data that are difficult to interpret otherwise.
Case Study Examples
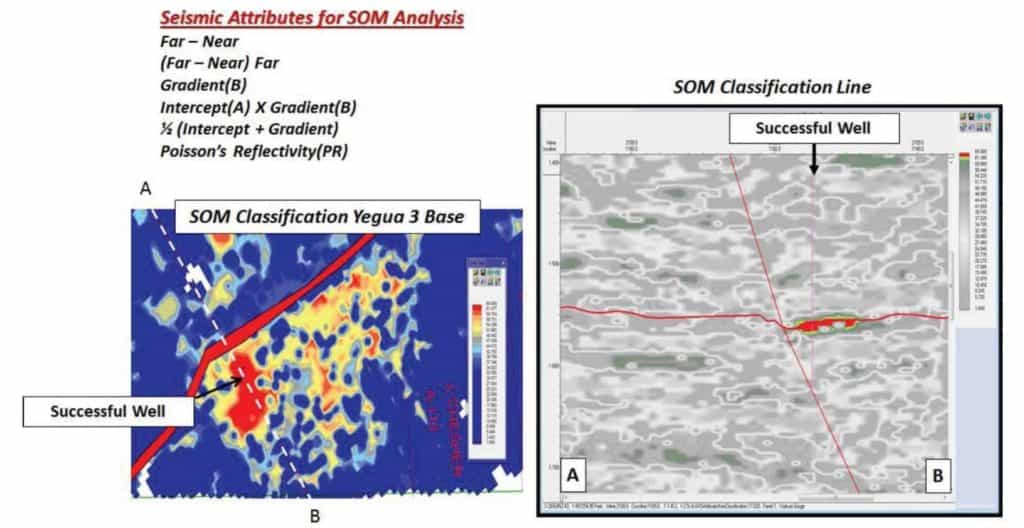
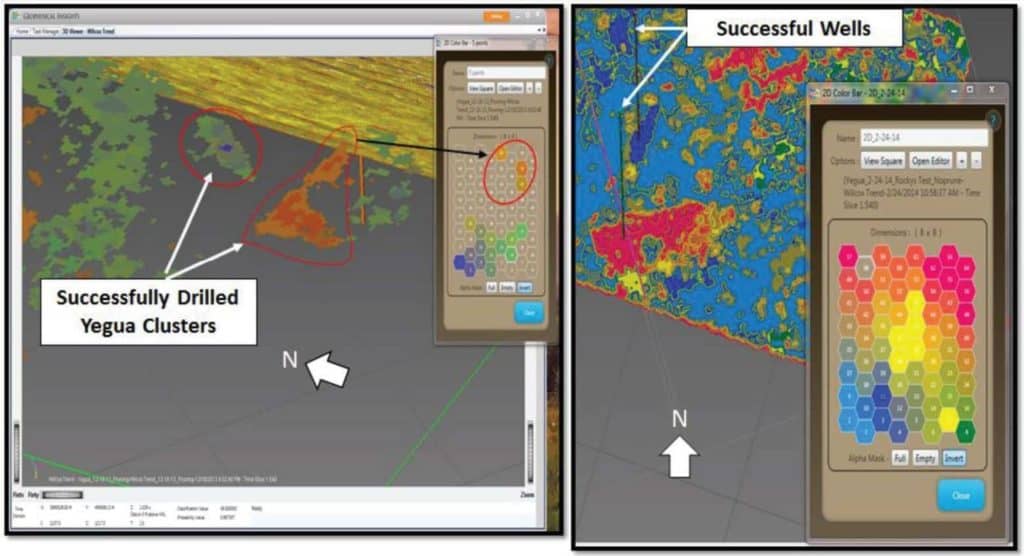
Once a set or perhaps several sets of seismic attributes are selected, often from a PCA evaluation, these sets of seismic attributes are input into separate SOM analyses. The SOM setup allows the interpreter to select the number of clusters, window size, and various training parameters for a SOM evaluation. Figure 2 displays the classification results from an onshore Texas geologic setting exploring for prospective Yegua sands. Hydrocarbon Yegua sands in this area typically produce Class 2 AVO seismic responses and the AVO seismic attributes employed in the SOM analysis are listed in Figure 2. The SOM classification map shows an anomalous area downthrown to a northeast-southwest trending fault which was drilled and found to be productive. The line displays the SOM anomaly through the field. Figure 3 displays volume rendered results of the SOM analysis where specific clusters or patterns are identified by associated 2D colormaps. An additional successful well was drilled north of the original well where a similar SOM anomaly was identified. The 2D colormaps are unique visualization approaches to identify geologic features and anomalous areas from SOM classification volumes.
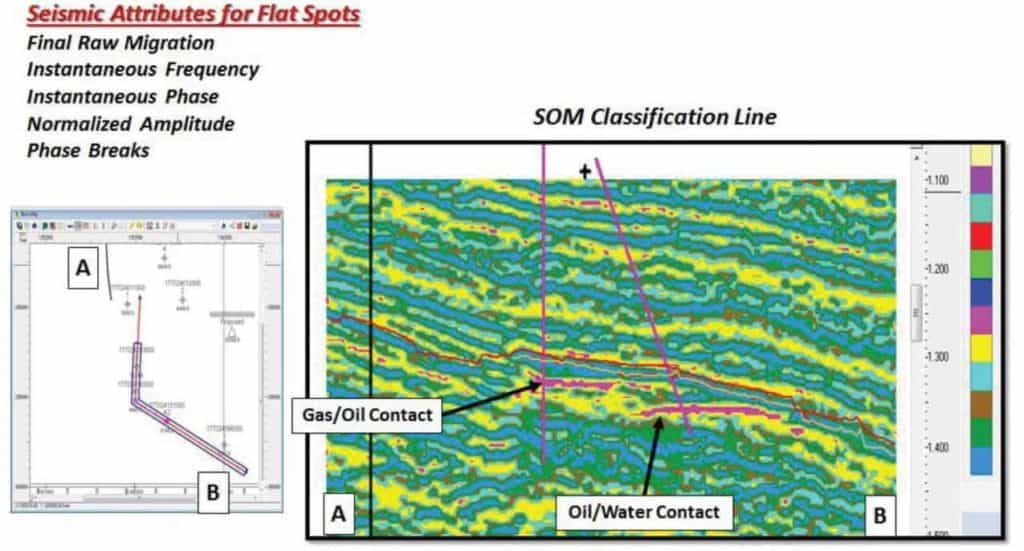
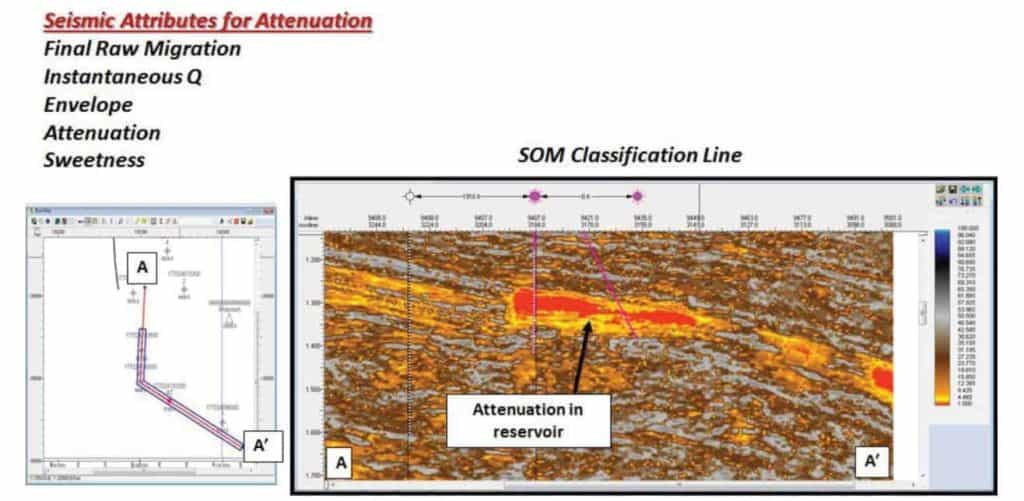
In a shallow water offshore Gulf of Mexico setting, anomalous seismic amplitudes were evaluated for DHI characteristics such as possible hydrocarbon contacts (flat spots) and attenuation with various SOM analyses. With input from PCA evaluation, Figure 4 lists the seismic attributes employed in an effort to identify flat spots. The SOM analyses for flat spots clearly denotes not only a gas/oil contact, but also an oil/water contact which was corroborated by two wells in the field. These hydrocarbon contacts were not clearly defined or identified from the conventional seismic data alone. To further evaluate this anomaly, a series of seismic attributes were selected to define attenuation, an important DHI characteristic and indicative of the presence of hydrocarbons. Figure 5 lists the seismic attributes employed in this SOM analysis. As the SOM classification line of Figure 5 displays, the anomalous attenuation effects in the hydrocarbon sand reservoir are very prominent. Figures 4 and 5 indicate with the appropriate selection of seismic attributes and SOM parameters, DHI characteristics such as flat spots and attenuation can be more easily identified with SOM analyses and ultimately decrease the risk in prospective targets for this geologic setting.
Conclusions
Seismic attributes help identify numerous geologic features in conventional seismic data. The application of Principal Component Analysis (PCA) can help interpreters identify seismic attributes that show the most variance in the data for a given geologic setting and help determine which attributes to use in a multi-attribute analysis using Self-Organizing Maps (SOMs). Applying current computing technology, visualization techniques, and understanding of appropriate parameters for SOM, enable interpreters to take multiple seismic attributes and identify the natural organizational patterns in the data. Multiple attribute analyses are beneficial when single attributes are indistinct. These natural patterns or clusters represent geologic information embedded in the data and can help identify geologic features that often cannot be interpreted by any other means. The application of SOM to bring out geologic features and anomalies of significance may indicate this approach represents the next generation of advanced interpretation.
Acknowledgements
The author would like to thank the staff of Geophysical Insights for the research and development of the PCA and SOM applications. Thanks also to Deborah Sacrey for providing the information for the Yegua case study.
References
Abele, S. and R. Roden, 2012, Fracture detection interpretation beyond conventional seismic approaches: Poster AAPG-ICE, Milan.
Balch, A. H., 1971, Color sonograms: a new dimension in seismic data interpretation: Geophysics, 36, 1074–1098.
Barnes, A., 2006, Too many seismic attributes? CSEG Recorder, March, 41–45. Chopra, S. and K. Marfurt, 2007, Seismic attributes for prospect identification and reservoir characterization: SEG Geophysical Development Series No. 11.
Coleou, T., M. Poupon, and A. Kostia, 2003, Unsupervised seismic facies classification: A review and comparison of techniques and implementation: The Leading Edge, 22, 942–953.
Kohonen, T., 2001, Self Organizing Maps: third extended addition, Springer Series in Information Services, Vol. 30.
Liner, C., 1999, Elements of 3-D Seismology: PennWell.
Schlumberger Oilfield Glossary, online reference.
Smith, T. and M. T. Taner, 2010, Natural Clusters in Multi-Attribute Seismics Found With Self-Organizing Maps: Extended Abstracts, Robinson-Treitel Spring Symposium by GSH/SEG, March 10-11, 2010, Houston, Tx.
Taner, M. T., F. Koehler, and R. E. Sheriff, 1979, Complex seismic trace analysis: Geophysics, 44, 1041–1063.
Taner, M. T., and R. E. Sheriff, 1977, Application of amplitude, frequency, and other attributes, to stratigraphic and hydrocarbon determination, in C. E. Payton, ed., Applications to hydrocarbonexploration: AAPG Memoir 26, 301–327.
Taner, M.T., S. Treitel, and T. Smith, 2009, Self-Organizing Maps of Multi-Attribute 3D Seismic Reflection Surveys: SEG 2009 Workshop on “What’s New In Seismic Interpretation?,” Houston, Tx.


