By Sharareh Manouchehri, Nam Pham, Terje A. Hellem and Rocky Roden | Published with permission: First Break | Volume 38, July 2020
Table of contents
Introduction
This paper presents a multidisciplinary approach, maximizing information extraction from seismic data to predict lithofacies and reservoir properties, based on the following steps:
- Multi-attribute seismic analysis based on an unsupervised machine learning process called Self-Organizing Maps (SOMs). The selection of input attributes was thoroughly tested and optimized, based on close cooperation between geophysicists and geologists to extract more extensive and detailed geological features from seismic data.
- Using the information from nearby wells and knowledge of rock physics, the individual neural classes were quantified and validated and then reorganized and translated to formation properties such as lithofacies, porosity, and clay content.
The study focused on the benefits and additional information that can be gained with this new approach compared to traditional quantitative interpretation, i.e., a prediction from acoustic impedance. Multi-attribute classification using machine learning (SOM) gave a better representation of the seismic characters, detecting the geologic trends in the field. A detailed quantitative interpretation of SOM neural classes was established to validate and translate formation-related classes optimally for reservoir prediction, and to eliminate classes irrelevant to the formations (i.e., seismic noise).
The result from this (‘Wisting’) case study shows that the new method gives the best match to the well data and extracts more reservoir-related information from seismic data compared to the conventional quantitative interpretation (QI) approach. In the upper part of the Triassic, with fluvial sediments assigned to the RG2 unit (Fruholmen Fm.), the reservoir quality and extent of mud clast-rich channel intervals are debated. In two of the wells, E and B, (see disclaimer at the end of the paper), a thicker mud unit was observed, and it was debated if this could act as a barrier to the overlying good reservoir. The result shows that the mud intervals are deposited locally and do not represent a regional mud layer. The additional information from seismic data seems to be valuable when used as input and refinement to the digital geological model.
Geological setting and challenges
This study is part of a multidisciplinary activity performed by Idemitsu Petroleum Norge AS (IPN) aiming at establishing a full-field geological model of the Wisting discovery as input to the production planning and development.
The Wisting and Hanssen discoveries are located in blocks 7324/7 and 7324/8 in the Norwegian sector of the Barents Sea (Figure 1a). The production licence PL537 was awarded in 2009 with OMV (25%) as the operator. Other partners include Equinor (35%), IPN (20%) and Petoro (20%). Equinor has recently taken over as operator for the development phase of the Wisting & Hanssen discoveries, with OMV due to regain operatorship at the start-up of production.
The first well was drilled in 2013 and made an oil discovery in the Wisting Central fault segment. The reservoir comprises the Late Triassic to Middle Jurassic Realgrunnen Subgroup (Figure 1b).
The lithostratigraphic nomenclature for the Triassic and Juras- sic generally applied in the Norwegian sector of the Barents Sea was initially defined based on type wells in the Hammerfest Basin (Dalland et al., 1988). Many companies use biostratigraphy as the basis for applying this nomenclature at a formation level in other basins and even structures hundreds of kilometres away from the type area. However, the IPN team applied a neutral subdivision of the reservoir according to four flow units designated RG1 to RG4, as denoted in Figure 1b. The uppermost unit of the Realgrunnen Subgroup (RG1) is the Stø Formation, which is the most prolific reservoir of the Norwegian sector of the Barents Sea.
To date, six wells have been drilled in the licence area. Except for a deviated well, which aimed to test deeper stratigraphic levels in the Hanssen structure, and a horizontal well that passes through three fault blocks, the four vertical wells tested four individual fault blocks. The most promising structures were named after Roald Amundsen’s companions who reached the South Pole in 1911; Olav Bjaaland, Helmer Hanssen, Sverre Hassel, and Oscar Wisting. Based on the wells in the Wisting Central and Hanssen structures, the licence partners focused mainly on the Stø Formation (RG1) as the producible reservoir. IPN’s RG2 (Fruholmen Fm.) was inferred as representing isolated fluvial channels deposited within a flood plain with low vertical and horizontal communication. In addition, the mud intervals at the top of RG2 in wells E and B were considered to represent a major flooding event that works as a barrier to communication between RG1 and RG2.
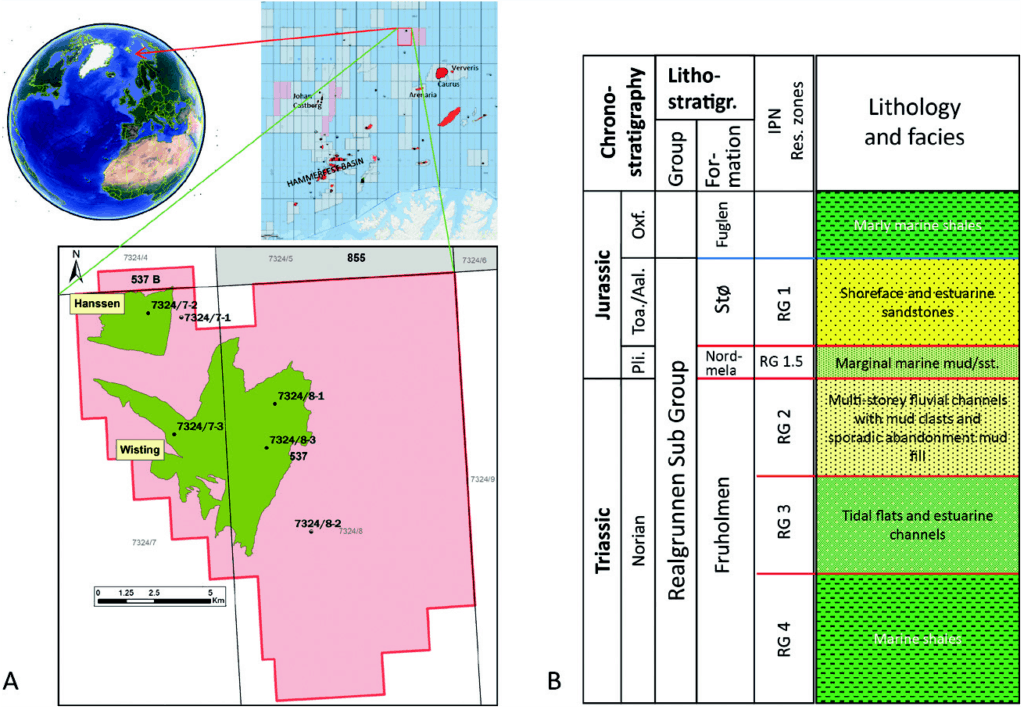
Based on observations on very detailed seismic site survey data, IPN inferred an alternative model for RG2 as amalgamated channels of fluvial and estuarine origin filling more extensive incised valleys during a fall in sea level. The challenges have been to document that this unit comprises significant producible resources, and that the contact between RG1 and RG2 represents a regional unconformity known in the Barents Sea and throughout Arctic Canada as the ‘Rhaetian unconformity’ (Embry, 2011; Lord et al., 2019). Within the licence area, the biostratigraphic data show that there is a break in the stratigraphy from the Norian (RG2) to Pliensbachian (RG1.5). The mud intervals at the top of RG2 in wells E and B are most likely local infill of abandoned channels or oxbow lakes at different Norian stratigraphic levels.
The incisions into the RG3 and other intraformational mud layers during deposition of RG2 have left several intervals of mudclast-conglomerates within the fluvial channel deposits. IPN infers these mudclast-conglomerates as representing the outer bends of the fluvial channels eroding into older, mud-dominated facies. In contrast, the dominant part of the channel deposits is cleaner sands. In the cores from the Wisting and Hanssen discovery wells, the base of the channels within RG2 is dominated by the mud clasts. The mud clast intervals are characterized by high gamma response and low porosity. Based on the well logs, these intervals might be mistaken as mudstones. Except for a few scattered mud intervals, no typical flood plain deposits have been encountered within the RG2. The cored interval in well B shows more variation, including very good reservoir sands. The logs from the uncored wells, D and A, show the typical bell-shaped log response of some of the channels. This supports our understand- ing of the facies within the fluvial channels.
IPN saw the potential of using the machine learning capabilities of the Paradise software applied to the 3D high-resolution P-cable seismic data, which was acquired in 2016. The interpretation team expected the commercial software to assist in resolving the problem of documenting the more complex facies distribution indicated by the well data for the units below the RG1 (Stø Fm.)
Application of multi-attribute analysis using machine learning
Principal Component Analysis (PCA) was used first to determine the relative variance – ‘responsiveness’ — among a larger set of candidate attributes (Roden et al., 2015). Three attributes were identified that imparted the greatest energy to the study area: Acoustic Impedance (AI), Envelope, and Attenuation (Instantaneous Q), with AI and Envelope being significantly dominant. AI is the primary indicator of rock properties, and Envelope is a function of the complex seismic trace. The AI shows the absolute value (cumulative sum of seismic responses), while Envelope is a measure of the total energy involved in the seismic reflection response. In terms of application, AI detects rock bodies and layers while Envelope is a physical attribute that is effective in discriminating sequence boundaries. Though less dominant, Instantaneous Q has been known to correlate to physical rock properties such as porosity (Ogiesoba, 2016). The multi-attribute analysis used the Self-Organizing Map (SOM) machine learning process, which is a non-linear, robust classification method. The SOM process, developed initially by Teuvo Kohonen, reveals similarities in the classification results (Kohenen, 1982, 2001). The commercial machine learning software employed in the project produces the SOM classification results by different numbers of classes, the quantity of which are selected by the user, e.g., 16, 25, 64, etc. Each class within a given result set corresponds to a neuron that has learned and classified patterns in the data through an unsupervised process, limited only by time or depth, horizons, and Inline-Crossline. The goal of the SOM process is to identify patterns that exist among a set of attribute volumes due to changes in geology and stratigraphy.
The software enables the running of multiple classification results and the comparing of those results to the ground truth. It also has the advantage of running numerous classification results using different numbers of neurons, called ‘neural configurations’. However, like other machine learning processes that are statistically derived, the SOM must be correlated to well control to refine the interpretation. Some multi-attribute classification results may relate to formation properties, while others do not. After evaluating the different number of classes — neural configurations — using the above sets of three attributes, the geoscience team concluded that 64 neural classes resulted in an optimum size that best corroborated to well control and the geology of the area.
Initially, the SOM process was applied to Acoustic Impedance (AI) and Envelope alone. However, after studying the cores and well data, some of the features could not be delineated using amplitude-based attributes. For example, the mudclast-conglomerate within cleaner sand deposits, which does not exhibit significant acoustic contrast and could not be discriminated from mud layers, is therefore undetectable using AI and Envelope. The two latter attributes exhibit minor variation of seismic dispersion and attenuation, therefore Instantaneous Q was added as an input to the SOM ‘recipe’ or set of attributes.
Machine learning, correlation statistics, and quantitative interpretation
Understanding rock physics is critical for the interpreter to differentiate between physical and non-physical data and noise or reservoir-related effects, thereby establishing a reliable/meaningful relationship between seismic responses and reservoir properties. The next step in the process was to quantify and validate the individual neural classes, then reorganize and translate the classes to formation properties such as lithofacies, porosity, and Vclay. The input acoustic impedance attribute was created based on a post-stack inversion, in which the background model was generated using only a single well. No depth trend was applied to avoid a compaction trend influencing the prediction of facies. The workflow, shown in Figure 2, illustrates the combination of the SOM machine learning process and statistical data analysis. The objective of the combination of statistics and machine learning was to obtain two types of predictions across specific zones:
- Reservoir properties (porosity and Vclay)
- Lithofacies
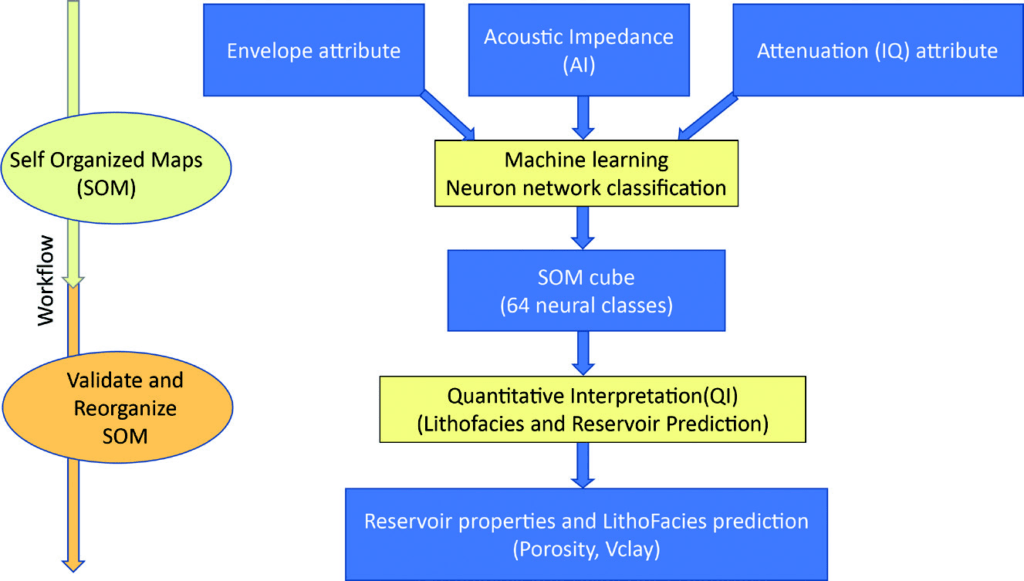
Correlation statistics were applied to the well log data and neural classification results to produce an overall quantitative analysis of the potential reservoir. Logs from five wells were statistically compared to the 64 neural classes (the neurons), while the log for a highly deviated, horizontal well was withheld as a blind test. The results show good correlation between specific neurons and the log data and justify being applied as guidance in the reservoir simulation model.
The relationships between AI and porosity (PHIT), AI and Vclay (VCL), and AI vs. individual neurons were evaluated (Figure 3). The relation between porosity and impedance aligns well with the rock physics trend, i.e., higher porosity, lower impedance, or opposite (Figure 3a). The presence of clay reduces porosity, thereby increasing impedance; however, a large amount of clay can also reduce impedance. For instance in the RG-3 unit, since clay has a lower bulk modulus than sand. A small amount of cementation (1-2%) for clean sandstone leads to stiffening of the rock matrix, thus increasing impedance in the case of RG1.
Together, these factors produce a non-linear and scattered relationship between porosity and AI; however, the reasonable correlation between AI and the neuron classes (Figure 3-c) demonstrate the following:
- The AI attribute strongly dominates the SOM cube.
- Neural classes from the SOM are a good predictor of porosity and are consistent with AI.
- Data away from the main trend is influenced by other attributes and yields additional reservoir-related information that is not available through traditional interpretation methods.

Property results vs. ground truth
The commercial machine-learning software includes a 2D Colourmap (Figure 3c) with the neurons arranged in a numbered array, in this case 1 to 64. Where two neurons are adjacent, their properties are most similar, while the farther apart they are located on the 2D ‘neural’ map, or neural topology, the more dissimilar the properties. The number of the neurons indicates a relative location on the map, starting with number 1 in the lower left and proceeding left to right, bottom to top. Given that the input to the SOM was three attributes, each neuron had a different mix or weight of attributes, and that relative make-up of each neuron is available for inspection within the software. An analysis of the composition of individual neurons to the attributes comprising each neural class demonstrated that AI was the main contributor. Since the SOM cube was found to be strongly dominated by AI, it also was a good predictor of porosity; however, the data away from the main trend was found to be governed by other attributes, which yielded additional reservoir-related information.
The large scatter in the data suggested that each neuron be examined independently relative to porosity (PHIT) and Vclay (VCL). The ordering of the neural classes (say neurons 40 vs. 41)does not have a continuous analog relationship within the 2D Colourmap. Rather, they exist as independent discrete classes, related only by similarity, according to the SOM Kohonen process. Therefore, gridding, interpolating, smoothing, and the removal of bad data was applied to the individual neurons within the 2D Colourmap to increase the neighbouring dependency among neurons, producing better lateral continuity and a more stable result.
Building on the idea of the 2D Colourmap, the prediction method involved creating a 2D property map, instead of 1D (Figure 4). The zones were subdivided into two: RG1 and RG2,3. RG1 has high porosity, but relatively high impedance due to a small amount of cementation. This is the opposite of the general trend between AI and porosity (higher porosity, lower impedance), such as in RG2,3, which made adding zonation necessary. As input to the training dataset, the log data was upscaled at 1.5 m to minimize the effect of differing scales. (The upscaling would also allow a direct input to the geological model later in the workflow.) To avoid overtraining and to generate a more stable result that was less sensitive to noise, data samples were used between +/- 1 inline and crossline around the well, yielding many more data samples while mitigating the effect of noise on the training data.

Figure 4 shows 2D property maps of porosity (PHIT) and Vclay (VCL) in the zones for RG2 and 3. In general, the SOM 2D Colourmap (Figure 4b) shows high porosity, clean sand in the upper left corner, and low porosity, high VCL in the lower part.
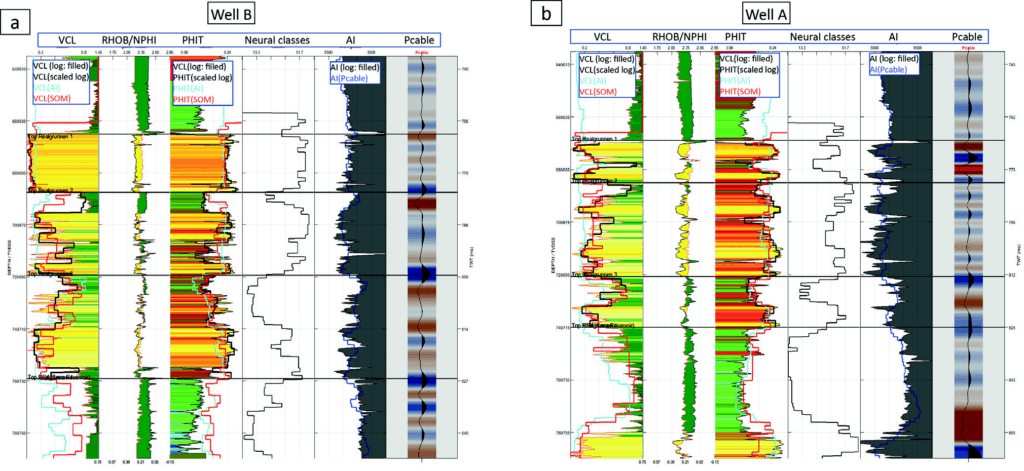
For comparison and quality control, the prediction result from the new method was compared to the conventional method where porosity and clay content is derived from acoustic impedance (ref. Figure 3a-c). Figure 5 shows the predicted results versus the logs for wells A (Figure 5b) and B (Figure 5a), which are representative of the Wisting and Hanssen discoveries. The prediction of properties from AI alone is a fair match to the log data; however, the prediction from the SOM process using the three attributes referenced above shows the best match. AI is not sensitive to lithology variation in RG2, while the SOM multi-attribute classification can detect lithology variation (mud plug and mudclast-conglomerate) in RG2. The presence of lower porosity zones was also more accurately predicted by the machine learning results when compared to AI alone. Note that the SOM is optimized for the RG interval and is not valid for intervals above and below.
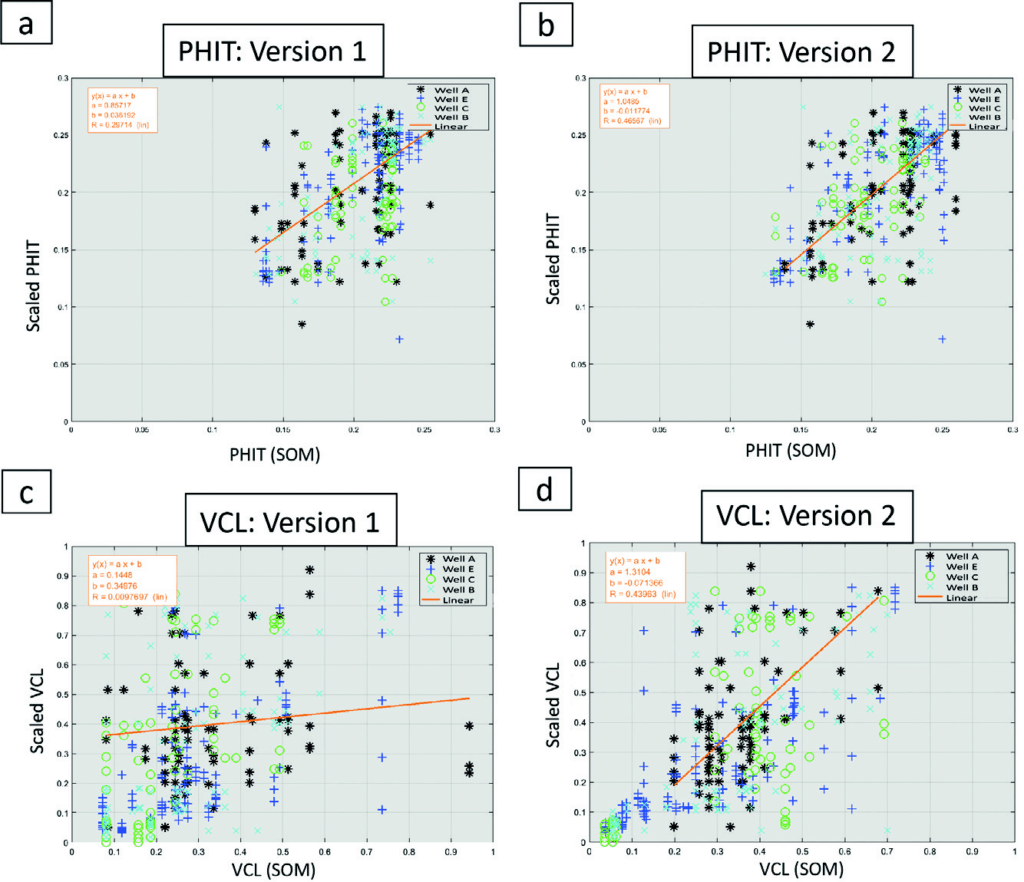
Cross plots of porosity (PHIT) and Vclay (VCL) in Figure 6 show the improvement in correlation factors for the two properties. Version 1 (Figure 6a,b) was predicted directly from 64 neural classes without applying the neuron numbering dependency on the 2D Colourmap, and before subdividing the zones RG1 and RG2,3. Following these changes in the prediction method, the correlation factors increased respectively: porosity from 0.3 to 0.47 and VCL from 0.01 to 0.44, as shown in the charts on the right identified as Version 2 (Figure 6b,d). A correlation factor approaching 0.5 is considered very good since the prediction is based on seismic data, thereby enabling a reliable estimation of the trend away from the well.
A physical rock trend for Vclay prediction was applied to obtain an optimal result, which improved prediction by avoiding overfitting and minimizing the impact of noise. With a hard rock trend (AI-VCL trend, ref. to Figure 3), those neural classes were removed for prediction away from the AI-VCL trend, retaining only those close to the main trend (Figure 7b). With the soft rock trend, those neural classes which are away from the main rock trend were included for prediction, i.e., including other attributes (Envelope and Inst. Q). To stabilize the prediction result and minimize noise effect, some neural classes, which predicted a large variance with the main rock trend, were also excluded.
Figure 7a shows Vclay prediction derived from AI, which is a fair match to the well, while the prediction with the hard rock trend (Figure 7b) is comparable to the one derived from AI. With the soft rock trend, including the contribution from other attributes, additional information, such as thin layer features, can be observed (Figure 7c). The mudclast-conglomerate channel features and patterns are detected using the soft rock trend, especially in middle and lower RG2, (ref. to red arrows), and are confirmed by nearby wells (B and C). The prediction result in 7c reflects the geological interpretation of RG2. Several intervals of mudclast-conglomerate within the fluvial channel represent the outer bends of the fluvial channels eroding into older mud dominated facies, while the dominant part of the channel deposits are comprised of cleaner sands. The prediction with the soft rock trend gives the best match to the well and is the final version.
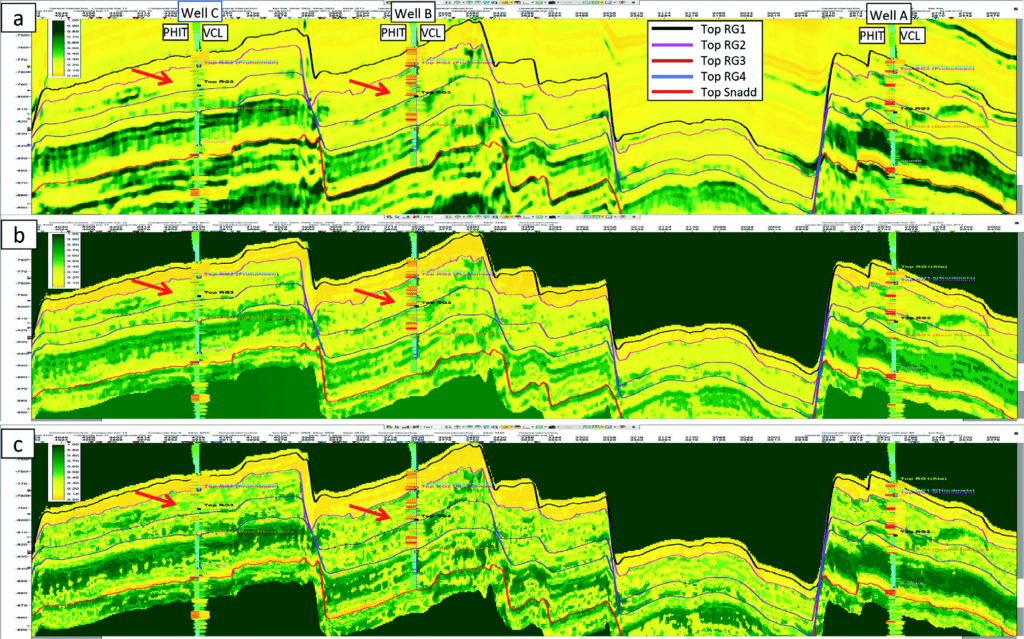
Figure 8 shows Vclay maps at upper RG2, derived from acoustic impedance (8a), multi-attribute classification (SOM) with hard rock trend (8b), and the soft rock trend (8c). The acoustic impedance with low frequency can only detect thick layers. At the same time, the Vclay prediction with the soft rock trend, including other attributes, can pick up thin layers, including more channel features. Roden (Roden et al., 2017) identified the phenomenon of multi-attribute classification detecting thin beds below seismic tuning thickness when multiple attributes are classified simultaneously at a single-sample scale. The red arrows and polygons highlight the possible channel features, which are apparent in (8c), while those features are not visible or unclear are in (8a). The channel features crossing well 7324/8-3 (E-W direction) and well 7324/7-2 (N-S direction) appeared locally. These features are related to high Vclay and low porosity found in the wells, which are interpreted as mud plugs, according to the core description.

Figure 9a shows a comparison of the core description, well logs, SOM, and prediction of PHIT and VCL for well B. The SOM classification to the left of the logs relates to the SOM 2D Colourmap in Figure 9b. Wireline logs GR, DEN, NEU, and AC (compressional sonic) are shown in the next column, followed to the right by the core description made by Ichron Ltd for PL537. The grain size is accentuated by these colours: yellow for clean fine-to-coarse sandstones; light yellow indicates argillaceous very-fine-to-fine sandstone; various shades of green indicate claystones-to-siltstones; and orange indicates the mud clast conglomerates. Sedimentary structures such as cross-bedding, lamination, and bioturbation are not readable at the presented scale but are designated between the lithology column to the left and the grain size curve to the right. The two columns to the right show the colour-shaded PHIT and VCL logs calculated from the soft rock trend as described above (Figures 5 and 7), the unshaded logs in the background are upscaled logs based on the well logs. Figure 9b shows a SOM with colour-coding based on visual comparison of the classification log, as shown in Figure 9a (left column) and the core descriptions and facies inferred from wireline logs of the vertical wells within the seismic survey.
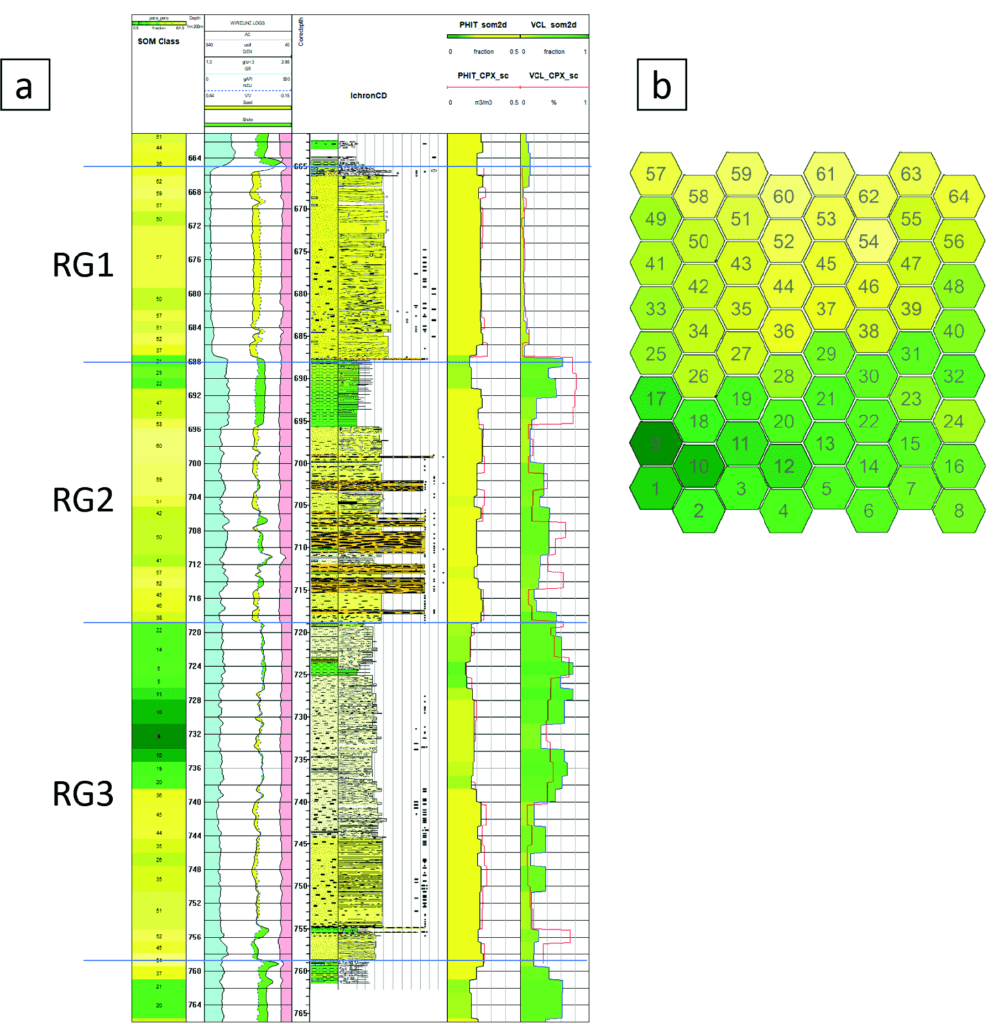
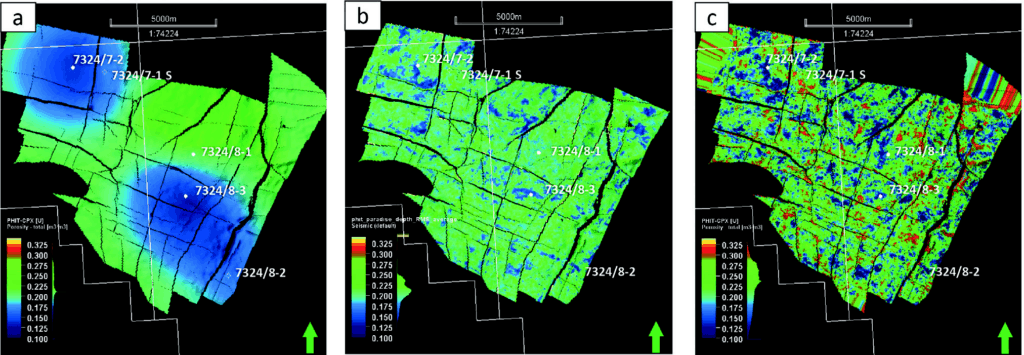
Figure 10 demonstrates the impact of using porosity prediction from multi-attribute classification (SOM) into the geological model. Figure 10a (extrapolation from wells) shows a large area (blue colour) surrounding wells 7324/8-3 and 7324/7-2 dominated by low porosity away from the wells, while the prediction from the SOM classification (10b) indicates low porosity channel features crossing the wells which are deposited locally. As a result, by applying this 3D cube as the trend for modelling, the porosity (10c) shows a higher average than the one using well only (10a) and seems to gain more geological details.
Observations and discussion
As summarized below, the results from the study using machine learning show better alignment with well data in comparison to the traditional QI approach, and it provides additional information such as the detection of thin layers and channel features.
- Input attributes to SOM classification: AI is the primary indicator of rock properties, detecting rock bodies and layers, while Envelope is a function of the complex seismic trace and is effective in discriminating sequence boundaries. For thin layers. The sequence boundaries from Envelope are the same as the sequence bodies and therefore contribute to the detection of thin layers and channel features. Inst. Q represents seismic dispersion and attenuation, derived from instantaneous frequency, Envelope, and its derivative. Inst. Q is, therefore, susceptible to signal variation, thin layers, and channel features, but it is also sensitive to noise. Together, A.I., Envelope, and Inst. Q represent detailed signal characteristics of seismic.
- Classification using machine learning (SOM): SOM gives a better representation of the multi-input data. Unlike supervised machine learning using well data, the SOM method does not require well data as input. Therefore, the training can be run on the whole dataset, searching for different combinations/classes, geological channel features, and patterns from seismic. After several tests with different numbers of classes (neural configurations) and close cooperation in the team, 64 neural classes were produced and organized by SOM classification, representing best corroboration to well control and the geology of the area.
- Quantitative interpretation: SOM classification is unsupervised machine learning, based on a statistical approach. How- ever, the classification and ordering of the neural classes are well organized on the 2D-SOM map following their similarity characterization, i.e., neuron nr. 28 is in a family with neurons nr. 19, 20, 21, 27, 29 and 36. This clever organization is exploited and used for quantitative interpretation in this study. Using the information from wells and knowledge of rock physics, several exercises have been carried out to improve the results. These include property smoothing on a 2D SOMmap, subdividing the reservoir zones, and applying soft and hard rock trends, have been carried out to improve the results. The individual neural classes were quantified and validated, then reorganized and translated to formation properties. Classes irrelevant to formations, i.e., seismic noise and other artifacts, were eliminated or minimized.
The study shows promising results. However, there is potential for improvement in exploiting more information from seismic while eliminating noise and other artifacts.
Conclusions
Several wells were used to quantify the 64 neural classes and translate the classes to lithofacies and reservoir properties, such as porosity and Vclay. The following results show good correlation with the log data and may provide additional detailed input for the geological model and eventually the reservoir simulation model:
- Distribution of the shale layer observed in RG2 at well B seems to be localized/limited. The limited amount of shale observed in RG2 may indicate good lateral and vertical
- Blind test along the horizontal well path confirms a good relationship between the prediction result and the well
This study demonstrates a clear improvement in reservoir characterization compared to the traditional QI approach (quantitative interpretation). More information was gained from seismic data for input into reservoir prediction. The successful result is based on close cooperation of different disciplines and specialists, while applying machine learning, statistics, rock physics and a firm geological understanding of the region.
Acknowledgments
The authors would like to thank the PL 537 licence partners for permission to publish this paper. We would also like to thank to our colleagues in IPN: Toshiro Tamura, Tone Merete Øksenvåg and Marius Lunde for their contributions. Thanks also are extended to Geophysical Research, LLC (d/b/a Geophysical Insights) for the research and development of the Paradise AI workbench and the machine learning applications used in this paper. Finally, we would like to thank Hal Green for review of the manuscript and Leah Mann for editing the graphics.
Disclaimer
The names of the wells herein are anonymous on the well logs and cross-sections. The conclusions set forth above are those of the authors and do not necessarily represent the licence partners or policy of the licensing area.
References
Dalland, A., Worsley, D. and Ofstad, K. [1988]. A lithostratigraphical scheme for the Mesozoic and Cenozoic succession offshore mid- and northern Norway. NPD – Bulletin, 4, 65.
Embry, A. [2011]. Petroleum prospectivity of the Triassic-Jurassic succession of Sverdrup Basin, Canadian Artic Archipelago. In: (Eds.) Spencer, A.M., Embry, A.F., Gautier, D.L., Støupakova, A.V. and Sorensen, K., Arctic Petroleum Geology, Geological Society London, Memoir, 35, 545-558, Doi: 10.1144/M35.36
Lord, G.S., Mørk, M.B.E.,; Mørk, A. and Olaussen, S. [2019]. Sedi- mentology and petrography of the Svenskøya Formation on Hopen, Svalbard: an analogue to sandstone reservoirs in the Realgrunnen Subgroup. Polar Research, 38, Doi: 10.33265/polar.v38.3523.
Kohonen, T. [1982]. Self-organized formation of topologically correct feature maps. Biological Cybernetics, 43, 59-69.
Kohonen, T. [2001]. Self-Organizing Maps. Third Extended Edition. Springer Series in Information Sciences, 30, Springer-Verlag, Berlin, Germany.
Ogiesoba, O. [2016]. Application of the Instantaneous Quality Factor (Q) in the characterization of the Austin Chalk and Eagle Ford Shale, South Texas. AAPG Search and Discovery, #41781.
Roden R., Smith, T. and Sacrey, D. [2015]. Geologic pattern recognition from seismic attributes: Principal component analysis and self-organ- izing maps. Interpretation, 4, 59-83.
Roden, R., Smith, T., Santogrossi, P., Sacrey, D. and Jones, G. [2017]. Seismic Interpretation Below Tuning with Multi-attribute Analysis. The Leading Edge, 36 (4), 282-368.

