Hunton Findings
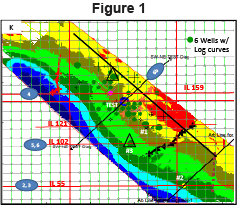
This Application Brief is a companion piece to another case study on findings in the Viola (Paradise Application Brief PC-1). Together, these two pieces describe a proof-of-concept project conducted to demonstrate the efficacy of the Paradise® multi-attribute analysis software. For this section, a structure map on the Wichita unconformity is used as an Index Map to all of the other figures.
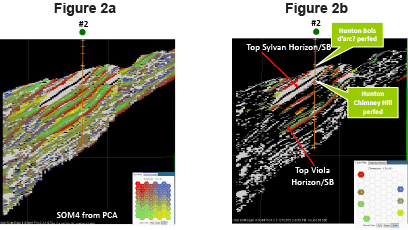
Figures 2a and 2b show the remarkable isolation of a Hunton objective above the Top of the Sylvan horizon and sequence boundary (black), another immediately below the Sylvan with a possible flat spot, and another updip of the well above the Top Viola with an apparent flat spot.
Null zone is the Top Sylvan Horizon Pick
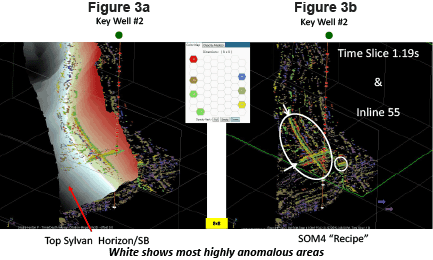
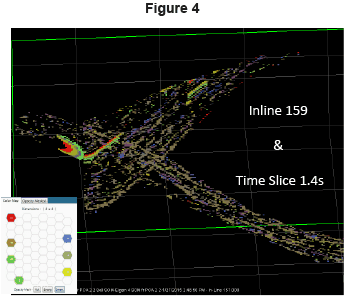
In Figures 3a and 3b transparency flip shows only the stratigraphy that was previously highlighted by white low probability. On the left, the Top Silvan horizon bisects the anomalous areas; its location is indicated by white arrow on the right. The extent of the anomalies is shown by the large white ellipse. The small ellipse indicates the location of a small anomaly that sits above the Top Viola. “Mining” the data set with the same multi-attribute result is as simple as moving the inline and timeslice through the volume till another area lights up (Figure 4). One can see that another anomaly is located downdip and further to the Northwest of the anomalies in Figure 3.
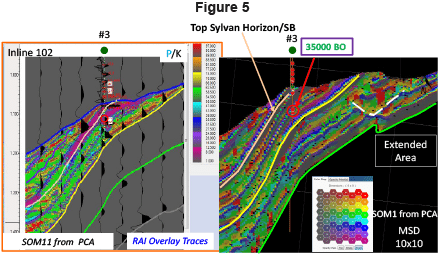
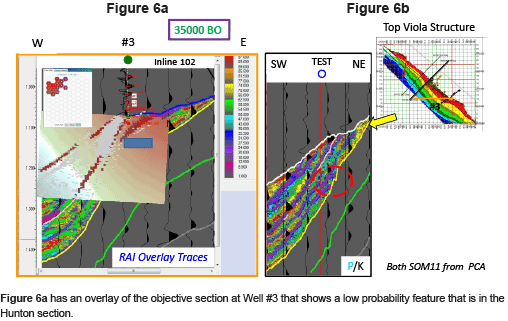
Key Well #3 was regarded as a “Type” Hunton well with a modest hydrocarbon recovery. However, the well was perforated in the Sylvan to exploit a smallish truncation trap. Figure 5 makes it abundantly clear that the perforations were taken pretty far downdip and would not produce much from the tapered reservoir. A take point further updip might have been planned that would still keep a fair distance from the unconformity. Also, if the well had been deepened it might have encountered a target at the base of the Sylvan that has very similar properties to the Test objective at the base of the Viola complete with pseudo flat spot at the base of its platform (Figure 6b).
Figure 6a has an overlay of the objective section at Well #3 that shows a low probability feature that is in the Hunton section.
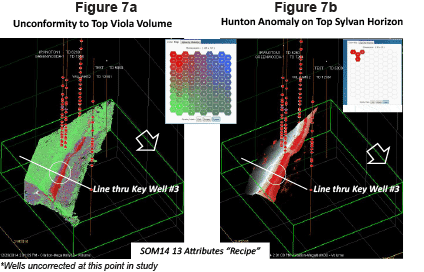
Figure 7a shows the red anomaly lit up within the volume and Figure 7b shows that trend in two parts and comprised of four red neurons. It is underlain by the Top Sylvan horizon. Note that this early result predated the well corrections so they are used here only as locaters on the trend to show that this anomaly may not have been fully exploited.
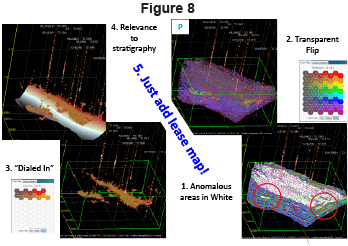
A summary of the workflow outlined in Figure 8 shows how quickly and effectively Paradise can be applied to hi-grade a leasehold!

