Spectral Decomposition (SD) is regarded as a useful tool for below-resolution seismic interpretation, reservoir thickness interpretation, and depositional structure enhancement. Amplitude components
using Normalized Instantaneous attributes help quantify thickness variability more reliably.
Phase components detect lateral discontinuities both stratigraphic and structural and also contribute to the segregation of various facies tracts. However, going beyond the visualization of one, two, or even three attributes at a time, this Application Brief describes the simultaneous analysis of multiple SD attributes using machine learning processes in Paradise®.
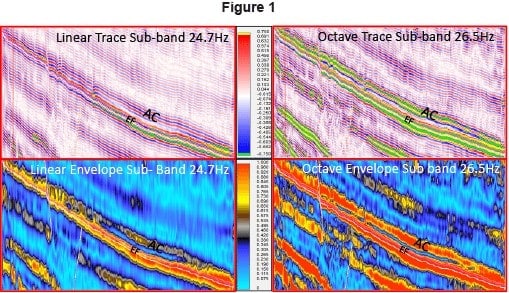
Initial steps were to take 20 sub bands from 8 to 85Hz. Run over the time interval of 1.5 to 3.2 seconds, the first three Eigenvectors yielded relatively low values for sub-bands 48.5 to 68.8Hz, moderate values for sub–bands 24.2 through 32.3Hz, and higher values for sub-bands 8 to 16.1Hz respectively. These results suggested a further look at the Linear/Octave Trace/envelope sub-bands from 12-50Hz. From these analyses, the Linear sub-band 24.7Hz and the Octave sub-band 26.5Hz stood out (Figure 1). The selections were based on the best resolution of the disconformity between the lower Austin Chalk and the Eagle Ford.
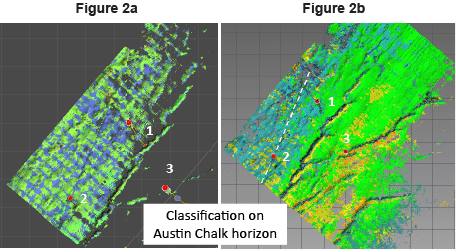
Instantaneous Principal Component Analysis (PCAs) and Self-Organizing Maps (SOMs) were applied using each of the two selected linear sub-bands as the base survey. When the data is delimited by area and by horizons (see Paradise Application Brief EF2), only one Eigenvector is dominant and the top two sub-bands, 24.2 and 28.3Hz, are those that encompass the aforementioned result. The SOM results from Linear 24.7Hz (Figure 2a) and 26.5Hz (Figure 2b) were then ghosted onto the Austin Chalk top for comparison. A subtle SW–NE trending fault encountered in the #2 well, which had not been seen using traditional methods, is resolved in Figure 2a; yet is a bit more subtle in Figure 2b.
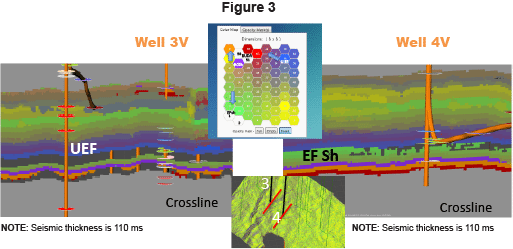
In Figure 3, the Instantaneous SOM result for the Linear 24.7Hz is displayed in SW to NE crosslines through two neighbor wells (see inset). It can be seen that stratal variations are rapid and subtle. In the Eagle Ford, turning off green neurons 1 and 2 blank out continuous bands in the upper Eagle Ford at Well 3, and at Well 4 only a smattering of pixels are gone. Also in the right view, two additional semi-continuous greens 9 and 17 in the upper part of the Eagle Ford shale are present. Both views share the basal green bands of neuron 25 and 26.
The purple band in these views is the unique lithology of the Basal Clay shale (BCS), a presumed pelagic deposit. In the underlying Buda, scour shapes in neuron 57 and 59 (red) on the left contrast starkly with the continuous bands of both facies in the vicinity of Well 4. Neuron “facies” 51 and 58 at well 3, not present on the line over Well 4, have been turned off to enhance the appearance of the scours. The overall thickness of the Buda shown is only 10ms.
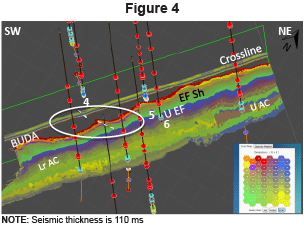
A time slice (Figure 4) in the area just downdip of the last figure shows detailed stacking variations across the upper Buda along its northern edge. Yellow neuron 49 facies come in above red 59 and underneath orange 58 of last figure, before the latter then the former laps out to the NE. A compressional fault is distinct in the time slice and is apparent throughout the vertical section in nearby crossline (circle). Probable karst features are apparent to the SW and NE in the uppermost Austin Chalk in both views.
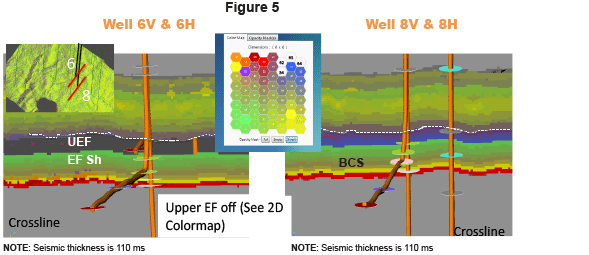
At the dip position of wells 6 and 8 on the Instantaneous Spectral Decomp (Figure 5), the
Upper Eagle Ford marl varies little in neuron sequence. With neurons 54, 62, 63, and 64 turned off across the #6 boreholes, the scour at the base of the Austin Chalk outlined by a white dashed line can be seen to carve into marl neuron facies 46 and 54. In this dip position, the Basal Clay Shale (BCS) is lowest olive color.
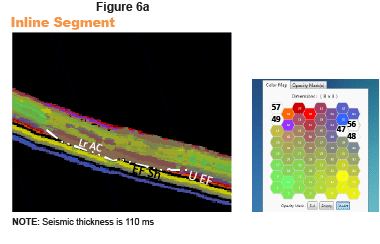
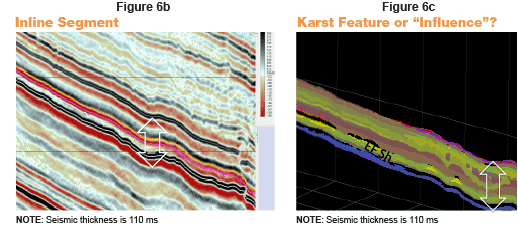
Similar features of the angular unconformity at the base of the Austin Chalk and phenomenal karsts can be seen on the Instantaneous SOM result for the Linear 26.5Hz result (Figure 6a, b, c) and are enhanced by the use of transparency. Corresponding neurons are turned off in the 2D Colormap in the upper left for the Upper Eagle Ford above the Eagle Ford shale and in the upper right for measures below the Eagle Ford shale. Note the absence of faults or any of the key stratigraphic features on conventional seismic display.
All seismic data owned and provided courtesy of Seitel, Inc.

