By Rocky Roden and Patricia Santogrossi | Published with permission: The First – SPE Norway Magazine | Volume 3 September 2017
Summary
The application of machine learning to classify seismic attributes at single sample resolution is producing results that reveal more reservoir characterization information than is available from traditional interpretation methods. Two consequences of applying machine learning with several appropriately chosen seismic attributes include the discrimination of thin beds that are below conventional seismic tuning and the identification of Direct Hydrocarbon Indicators (DHIs). These capabilities enable a higher resolution interpretation of reservoirs and stratigraphy. An explanation of the machine learning methodology and its application to thin beds and DHIs is described briefly in this paper.
Machine Learning Methodology
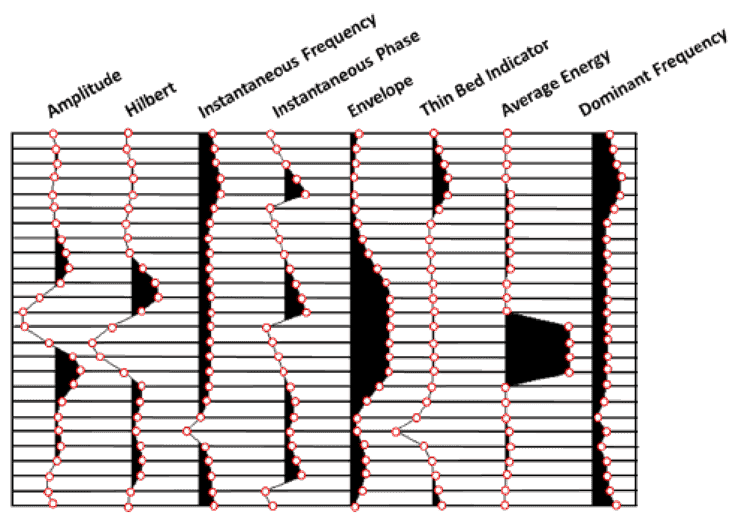
Taking advantage of today’s computing technology, visualization techniques, and an understanding of machine learning on seismic data, Self-Organizing Maps (SOMs) (Kohonen, 2001), efficiently distills multiple seismic attributes into classification and probability volumes (Smith and Taner, 2010). When applied on a multi-attribute seismic sample basis, SOM is a powerful nonlinear cluster analysis and pattern recognition machine learning approach that helps interpreters identify patterns in their data that can relate to inherent geologic characteristics and different aspects of their data. SOM analysis, which is an unsupervised neural network application, when properly applied has been able to reveal both thin beds and DHIs in appropriate geologic settings. Figure 1 illustrates a single seismic amplitude trace and seven different seismic attributes computed from the amplitude data. All of these traces are displayed in a wiggle-trace variable area format. This display represents 100 ms vertically and each horizontal scale line represents a sample (4 ms). Each of these attributes are at different scales and in some cases vastly different scales. It is evident from this Figure that each of the attributes measures a different component of the total acoustic energy at every sample. SOM identifies clusters where different combinations of attributes congregate to reveal significant information about the natural groupings that are difficult to view any other way. The self-organizing property of SOM identifies and classifies natural clusters.
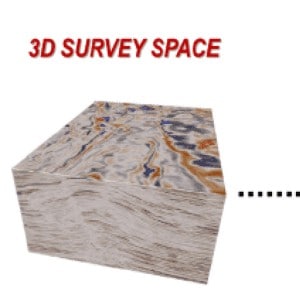
The SOM machine learning process is graphically presented in Figure 2. How large an area to select is dependent on the size of the geologic feature to be interpreted. For thin beds and DHIs, usually, a relatively thin zone of 50-250 ms around the anomalies is selected over a reasonable areal extent to provide sufficient data points for the SOM analysis. The selection of the seismic attributes is usually based on principal component analysis (PCA) and an interpreter’s knowledge of appropriate attributes for the area. Experience with SOM analysis has indicated that six to ten instantaneous seismic attributes are usually selected for thin beds and DHIs, depending on the geologic setting and data quality. In Figure 2 ten attributes are employed and all the data points from every sample from these attributes in the zone to be analyzed are placed in attribute space where they are normalized to put on the same scale. The SOM process employs cooperative and competitive learning techniques to identify the natural patterns or clusters in the data. Each pattern is identified by a neuron that sorts through the data in attribute space during the SOM training process of self-organization. In Figure 2 after training is completed, 64 winning neurons have identified 64 patterns or clusters in attribute space with an 8X8 neuron network. The SOM results are nonlinearly mapped back to a neuron topology map (2D colormap) where interpreters can select the winning neurons from the 2D colormap and identify in the 3D volume where the patterns and clusters occur for thin beds and DHIs.
In addition to the resultant classification volume, a probability volume is also generated which is a measure of the Euclidean distance from a data point to its associated winning neuron in attribute space (Roden et al., 2015). The winning neuron identifies a specific cluster or pattern. It has been discovered that a low classification probability corresponds to areas that are quite anomalous as opposed to high probability zones that relate to regional and common events in the data. Low probability anomalies identified by the SOM process are quite often associated with DHI characteristics.
Discriminating Thin Beds
The conventionally accepted definition of the tuning thickness (vertical resolution) is a bed that is ¼ wavelength in thickness, for which reflections from its upper and lower surfaces interfere and interference is constructive where the interface contrasts are of opposite polarity, often resulting in an exceptionally strong reflection (Sheriff, 2002). Several authors have described approaches to measure below tuning or thin beds usually employing various scaling techniques of amplitude or inversion data (MeckelandNath, 1977; Neidell and Poggiagliolmi, 1977; Schramm et al., 1977; Brown et al., 1986; and Connolly, 2007). However, these various techniques to determine thin beds have limitations and require assumptions that may not be met consistently (Simm, 2009). The application of SOM machine learning utilizing a multi-attribute classification has enabled the identification of thin beds and stratigraphy below tuning in a systematic and consistent manner as represented in the following case study.
The Eagle Ford Shale is a well-known unconventional resource play in Texas. Operators in this play must account for changing stratigraphy and facies to properly locate horizontal wells for optimum perforation intervals. The Eagle Ford stratigraphy is often associated with thin beds and facies well below conventional seismic resolution that change both vertically and laterally. This Eagle Ford case study contains 216 mi² (560 km²) of enhanced 3D PSTM data processed at a 2 ms sample interval. Conventional vertical resolution (tuning thickness) is 100-150 feet (30-45 meters) depending on the location within the Eagle Ford unit. In this study, over 300 wells were available for correlation including 23 type logs, 249 horizontal borehole montages, 9 vertical calibration wells with tops, logs, and time-depth corrections. Also available were five cores for which X-ray diffraction and saturation information was available. Well information was incorporated to corroborate the SOM results.
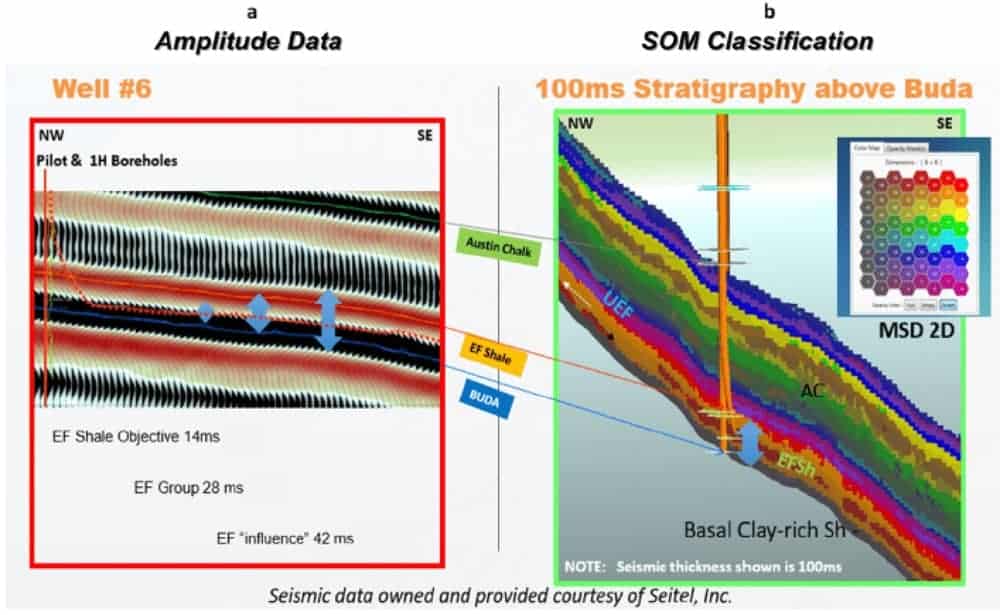
Ten instantaneous seismic attributes prominent in a Principal Component Analysis were selected for SOM. SOM training was conducted on a set of trial harvest lines and the successful line was then used to classify the entire survey. Figure 3a is a seismic amplitude line in color raster and wiggle-trace variable area formats across the location of Well 6 (V and 1H). The Figure shows the Austin Chalk-Eagle Ford Group-Buda stratigraphic interval represented by roughly 2.5 peak/trough cycles of a seismic trace. In the Eagle Ford, the amplitude appears continuous, yet any details are obscured because of the resolution limitations of the amplitude data where conventional tuning is 100-150 feet (30-45 meters). Figure 3b displays the equivalent line showing results of the SOM analysis. Sixty-four neurons were employed to identify 64 patterns in the data as seen on the associated 2D colormap. A seismic interval from 10 ms below the Buda to 100 ms above the Buda or near the top of the Austin Chalk was chosen for the SOM analysis. Shown clearly comparing Figures 3a and 3b is the resolution improvement provided by the SOM analysis over the seismic amplitude. The results reveal non-layer cake facies bands that include details in the Eagle Ford’s basal clay-rich shale, high resistivity and low resistivity Eagle Ford Shale objectives, the Eagle Ford ash, and the Upper Eagle Ford marl, which are overlain disconformably by the Austin Chalk (disconformity is a break in a sedimentary sequence that does not involve a difference in bedding angles). This interval of roughly 28 ms (or 14 samples) amounts to some 26 of the 64 SOM winning neurons to illuminate the various systems tracts within the Eagle Ford Group for this survey.
Adjacent to the SOM results at Well 6 are similar results at a nearby well. Figure 4a displays a zoomed-in vertical line display of the SOM results through Well 8(V) with the winning neurons identified. Figure 4b denotes the associated well log curves from well 8 and the correlative neuron associations. Winning neurons 63 and 64 are associated with the low resistivity Eagle Ford shale unit and neurons 53, 54, and 60 denote the high resistivity and more desirable Eagle Ford unit. The expanded display of the SOM results in Figure 4a denotes a low resistivity gold thin bed that is identified by a single neuron (#55) and is only one sample thick (2 ms). Shown here is clear evidence of consistent results between Wells 6 and 8 that lends itself to stratigraphic facies interpretation.
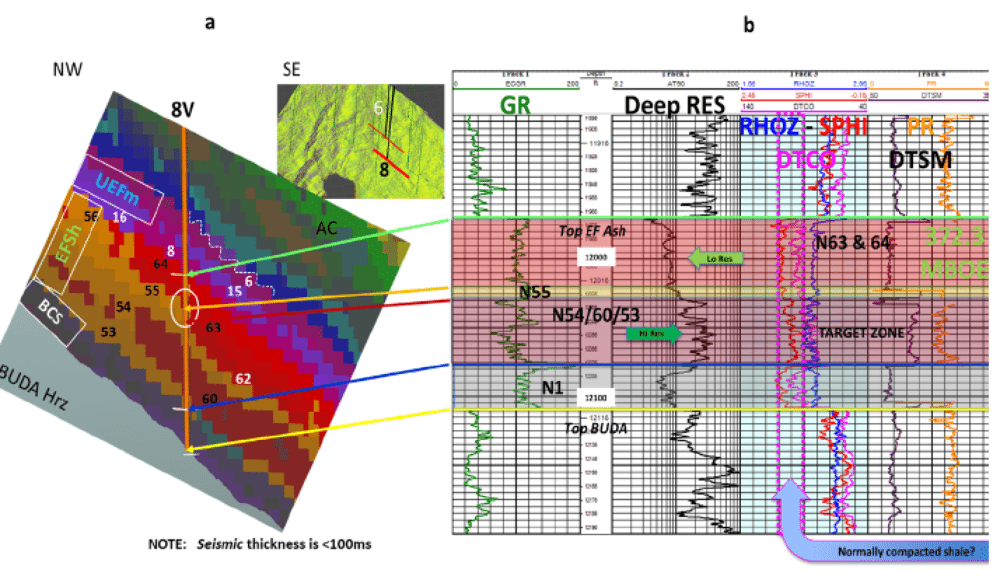
Over this survey area, 16 different winning neurons represent the various facies present in the Eagle Ford Shale over a 14 ms window (70-84 feet/21-26 meters). The facies of the entire Eagle Ford Group which includes the Basal Clay shale, Eagle Ford Shale, and Eagle Ford Marl, are defined by 26 different winning neurons over 28 ms (210-252 feet/64-77 meters). Individual facies units are as thin as one sample interval of 2 ms (10-12 feet/3-4 meters). These results of a single SOM classification are corroborated at multiple wells across the survey area.
Revealing Direct Hydrocarbon Indicators (DHIs)
The accurate interpretation of seismic DHI characteristics has proven to significantly improve the drilling success rates in the appropriate geologic setting where there is also adequate seismic data quality (Roden et al., 2012; Rudolph and Goulding, 2017). Specifically, DHIs are anomalies due to the presence of hydrocarbons induced by changes in rock physics properties (P and S wave velocities, and density). Typically, anomalies stand out as the difference in a hydrocarbon-filled reservoir in relation to the encasing rock or the brine portion of the reservoir. DHI characteristics are usually associated with anomalous seismic responses in a trapping configuration, such as structural traps, stratigraphic traps, or a combination of both. These include bright spots, flat spots, amplitude conformance to structure, etc. DHI anomalies are often compared to models, similar events, background trends, proven productive anomalies, and geologic features. DHI indicators can also be located below presumed trapped hydrocarbons where shadow zones or velocity pull-down effects may be present. These DHI effects can even be present and dispersed in the sediment column in the form of gas chimneys or clouds.
As described above there are numerous DHI characteristics and all of which should be evaluated in a consistent and systematic approach for any prospect or project. Forrest et al. (2010) and Roden et al. (2012) have identified the top four DHI characteristics, as related to commercially successful wells in a Class 3 AVO setting, based on an industry-wide database of almost 300 wells. These DHI characteristics include:
- Anomaly conformance to structure
- Phase or character change at the downdip edge of the anomaly
- Anomaly consistency in the mapped target area
- Flat spots
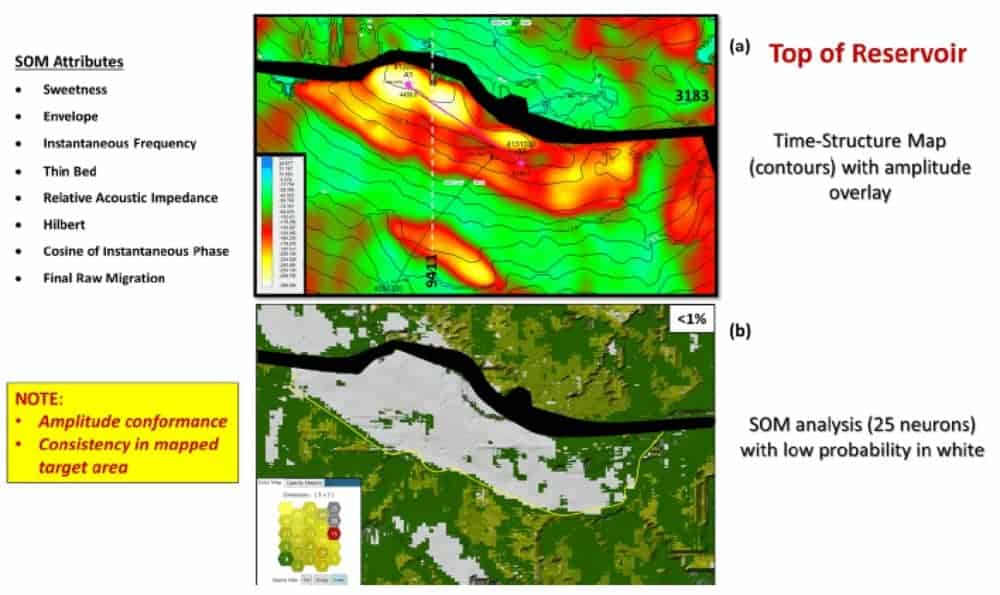
These DHI characteristics will be identified in the following case study by a multi-attribute SOM analysis. The case study is an offshore oil/gas field in 470 feet (145 meters) of water on the Louisiana continental shelf of the Gulf of Mexico. The field has two producing wells that were drilled on the upthrown side of a normal fault and into an amplitude anomaly. The normally pressured reservoir is approximately 100 feet (30 meters) thick and contains oil and gas. The hydrocarbon filled sandstone reservoir has low impedance compared to the encasing shales, indicative of a Class 3 AVO environment. The SOM analyzed a 170 ms window surrounding the reservoir. Applying the (SOM) multi-attribute analysis, a group of eight seismic attributes was selected based on Principal Component Analysis that would best expose Direct Hydrocarbon Indicators (DHIs). A neuron network of 5X5 (25 neurons) was employed. Figure 5a displays a time structure map as denoted by the contours with an amplitude overlay (color) from the mapped top of the reservoir in this field. The horizon at the top of the reservoir was picked on a trough (low impedance) on zero phase seismic data (SEG normal polarity).
Figure 5a indicates there is a relatively good amplitude conformance to structure based on the amplitude as noted by the general agreement of the time contour and the red/green amplitude break (see color bar insert). Figure 5b is a display of classification probability from the SOM analysis at the top of the reservoir at the same scale as Figure 5a. This indicates that the top of the reservoir exhibits an anomalous response from the SOM analysis. Ordinary classifications such as those of green and yellow-greens are shown around the reservoir (see colormap insert). However, within the reservoir and in several other areas, anomalous classification of low probability below 1% are colored white. In comparing Figure 5a and 5b it is apparent that the low probability area corresponds closely to the amplitude conformance to structure as denoted by the yellow outline in Figure 5b. This confirms the identification of the productive area with low probability and proves the efficacy of this SOM approach. The consistency of the low probability SOM response in the field is another positive DHI indicator. In fact, the probabilities as low as .01% still produce a consistent response over the field indicating how significant evaluating low probability anomalies is critical in the interpretation of DHI characteristics.
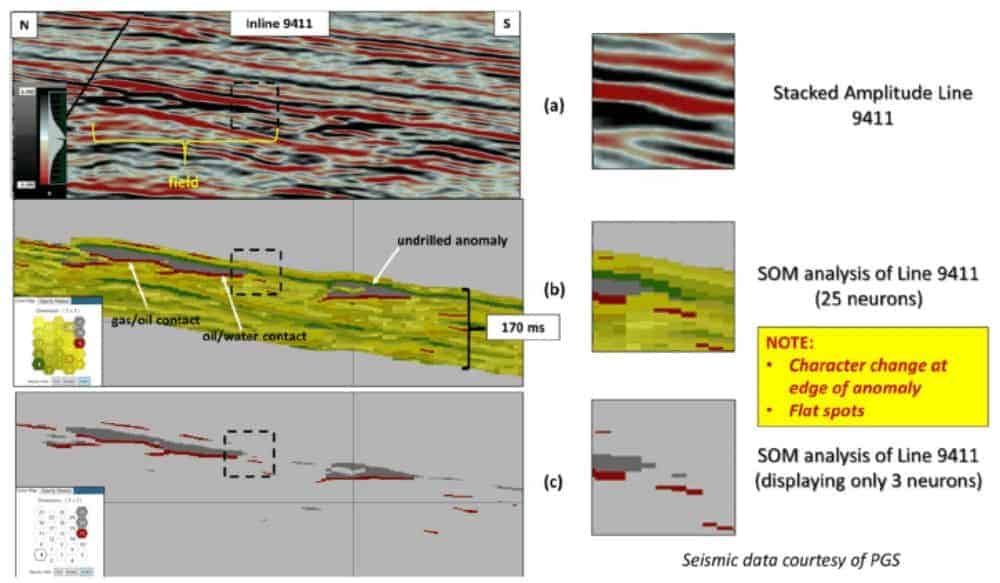
This field contains an oil phase with a gas cap and before drilling, there were hints of possible flat spots suggesting hydrocarbon contacts on the seismic data, but the evidence was inconsistent and not definitive. Figure 6 displays a north-south vertical inline seismic profile through the middle of the field with its location denoted in Figure 5. Figure 6a exhibits the initial stacked amplitude data with the location of the field marked. Figure 6b denotes the SOM analysis results of this same vertical inline which incorporates the eight instantaneous attributes listed with the 5X5 neuron matrix in Figure 5. The associated 2D colormap in Figure 6b denotes the 25 natural patterns or clusters identified from the SOM process (see colormap insert). It is apparent in Figure 6b that the reservoir and portions of both the gas/oil contact and the oil/water contact are easily identified as opposed to the conventional seismic data shown in Figure 6a. This is more easily seen in Figure 6c where the 2D colormap indicates that the neurons highlighted in gray (winning neurons 20 and 25) are defining the hydrocarbon-bearing portions of the reservoir above the hydrocarbon contacts and the flat spots interpreted as hydrocarbon contacts are designated by the rust-colored winning neuron 15. The location of the reservoir and hydrocarbon contacts are corroborated by well control (not shown). Note that the southern edge of the reservoir is revealed in the enlargements in the column on the right (from the dashed black box on left). A character change at the downdip edge of the anomaly where the oil contact thins out is easily identified compared to the line of amplitude change. Downdip of the field is another undrilled anomaly defined by the SOM analysis that exhibits similar DHI characteristics identified by the same neurons.
Conclusions
A seismic multi-attribute analysis utilizing Self-Organizing-Maps is a machine learning approach that distills information from numerous attributes on a sample-by-sample basis to provide a more accurate assessment of thin beds and DHI characteristics than conventional methods. We have shown in these cases that the results readily correlate to conventional well log data. The SOM classification process takes advantage of natural patterns in multiple seismic attributes space that is not restricted to the resolution limits of conventional amplitude data. This process enables interpreters to produce higher resolution interpretations of reservoirs and stratigraphy. Another advantage of a SOM analysis is the generation of classification probability where low probability anomalies are often associated with DHIs. SOM analyses in appropriate geologic settings can improve confidence in interpreting DHI characteristics and more clearly define reservoir edges and thin bed components.
References
Brown, A. R., R. M. Wright, K. D. Burkart, W. L. Abriel, and R. G. McBeath, 1986, Tuning effects, lithological effects and depositional effects in the seismic response of gas reservoirs: Geophysical Prospecting, 32, 623-647.
Connolly, P., 2007, A simple, robust algorithm for seismic net pay estimation: The Leading Edge, 26, 1278-1282.
Forrest, M., R. Roden, and R. Holeywell, 2010, Risking seismic amplitude anomaly prospects based on database trends: The Leading Edge, 5, 936-940.
Kohonen, T., 2001, Self-Organizing Maps: third extended edition, Springer Series in Information Services, Vol. 30.
Meckel, L. D., and A. K. Nath, 1977, Geologic consideration for stratigraphic modelling and interpretation. In: Payton, C. E. (Ed.) Seismic Stratigraphy- Applications to hydrocarbon Exploration. AAPG Memoir 26, 417-438.
Neidell, N. S., and E. Poggiagliolmi, 1977, Stratigraphic modeling and interpretation-Geophysical principles and techniques. In: Payton, C. E. (Ed.) Seismic Stratigraphy-Applications to hydrocarbon Exploration. AAPG Memoir 26, 389-416.
Roden, R., M. Forrest, and R. Holeywell, 2012, Relating seismic interpretation to reserve/resource calculations: Insights from a DHI consortium: The Leading Edge, 9, 1066-1074.
Roden, R., T. Smith, and D. Sacrey, 2015, Geologic pattern recognition from seismic attributes: Principal component analysis and self-organizing maps: Interpretation, 3, SAE59-SAE83.
Rudolph, K. W., and F. J. Goulding, 2017, Benchmarking exploration predictions and performance using 20+ yr of drilling results: One company’s experience: AAPG Bulletin, 101, 161-176.
Schramm Jr., M. W., E. V. Dedman, and J. P. Lindsey, 1977, Practical stratigraphic modeling and interpretation. In: Payton, C. E. (Ed.) Seismic Stratigraphy-Applications to hydrocarbon Exploration. AAPG Memoir 26, 477-502.
Sheriff, R. E., 2002, Encyclopedic dictionary of applied geophysics, 4th ed.: SEG.
Simm, R. W., 2009, Simple net pay estimation from seismic: a modelling study: First Break, 27, 45-53.
Smith, T. and M. T. Taner, 2010, Natural clusters in multi-attribute seismics found with self-organizing maps: Extended Abstracts, Robinson-Treitel Spring Symposium by GSH/SEG, March 10-11, 2010, Houston, Tx.

