Carolan Laudon, Jie Qi, Aldrin Rodon, Lamia Rouis and Hana Kabazi | Published with permission: First Break | October 2021
Abstract
Carolan Laudon, Jie Qi, Aldrin Rondon, Lamia Rouis and Hana Kabazi demonstrate how a combination of ML tools generates superior results versus a single method.
Introduction
The authors set out a methodology that uses a combination of machine learning (ML) techniques producing a seismic volume suitable for fault interpretation in a structurally complex field. Through theory and results, the paper will demonstrate that a combination of ML tools generates superior results versus a single method. The ML technologies applied are a supervised, deep learning, fault classification followed by an unsupervised, multi-attribute classification combining fault probability and instantaneous attributes.
Geologic setting and fault conditions
The study’s objective was to apply Machine Learning (ML) to a proprietary, reprocessed seismic dataset in the depth domain to generate a detailed, robust and reliable seismic fault attribute volume. The results were expected to be utilized in constructing a structural framework for an oilfield in the Caspian Sea.
The field was first drilled in 1966 over a highly faulted anticline structure and started production in 1972 from early to middle Pliocene aged sandstone reservoirs. A platform was installed in 2013 and started production in 2015 (Offshore Technology Newsletter, 2015).
The field sits within the Greater Cheleken area of the Southern Caspian Sea within a NW-SE dextral transcurrent fault zone (Figure 1). The tectonic setting of the field is described by Van Dijk and others (2018) as residing in the Apsheron Ridge between two large fault zones, the Apsheron-PreBalkan Fault Zone to the northwest and the Ashgabat Fault Zone to the southeast. Within the study area, the productive zone has been described by Van Dijk and others as ‘an asymmetrical top graben, with a deeper triangular shaped thrust-block, and an overall negative palm-tree shape in map view’. Hydrocarbon-bearing reservoirs comprise a stacked succession of interbedded reservoir sandstones and non-reservoir mudstones and siltstones, deposited within an alluvial and deltaic environment (Amu Darya Delta).

Figure 2 presents a N-S inline (survey orientation is 6 degrees east of north so inlines are labeled N-S) from the study volume through the main platform surface location. The top and base of the reservoir zone are shown by the pink and blue seismic horizons along with the original fault interpretation in dashed lines. A deep positive flower structure is evident and changes to a negative, graben dominated structure in the shallow section, demonstrating a complex fault system. Figure 3 is an unfaulted depth contour map of one of the main producing zone. Within the study area, the axis of the flower structure trends NW-SE so inlines at the eastern end of the survey have less faulting than the example shown in Figure 2 which is from the western part of the study area. Any field development plan must address the following geologic
issues:
- Structural and stratigraphic complexity
- Extremely fractured and compartmentalized reservoirs
- Numerous structural boundaries of the reservoirs are not clearly visible or not visible at all
- Clarity of fault intersections
- Fracture patterns and minor faulting are below conventional seismic resolution
The machine learning fault detection study had the following objectives:
- Identify major and minor structural features and their three-dimensional expression from seismic amplitude data including lateral and vertical correlation of the structural features
- Corroborate results with well data
- Validate or modify the existing geological/structural model
- Combine the output from the investigation with other seismic attributes
- Assess lateral and vertical correlation of the structural features
The ML technology was applied on recently reprocessed seismic data in an area spanning 25 Km2 with a vertical interval from 500 m to 5000 m. The bin spacing is 12.5 m x 25 m. Challenges for seismic data from the region includes the presence of high-pressure gas pockets and gas clouds which affect the seismic signal; data are relatively low fold and lower frequency, especially in the deeper levels, with vertical resolution in the range of 60 to 90 m. Drilling operations are challenging due to lack of resolution of fault locations from the seismic volume. Finally, all of the aforementioned issues affect the economics of the development.
Figure 4 shows additional views of the seismic amplitude volume used in the study, some of the wells in the field, and the faults as initially interpreted. The structure that defines the accumulation can be seen in the inline (Figure 2), but the cross line also shows many faults, and the depth slice demonstrates the complex and challenging geometries of the faults in the region.

Machine learning fault detection
Seismic amplitude is the basis for machine learning fault detection which uses deep learning Convolutional Neural Networks (CNNs), a form of supervised machine learning. The results produce unbiased fault volumes which can be used for seismic fault interpretation. Overall, the methodology saves compute time by using a pre-trained, robust, 3D synthetic fault model. This eliminates uncertainty in manually selecting faults to build the CNN fault engine. It also eliminates interpreter bias in the fault interpretation from which fault engines are created. These fault probability results can be easily converted to a fault interpretation framework.
The authors took the approach further by applying pre and post processing to the volumes used and by combining the CNN results with instantaneous seismic attributes in an unsupervised ML classification. This had the added value of making individual faults easier to identify and interpret and brings increased stratigraphic information to the results.
Fault detection process
As shown in the process diagram in Figure 5, the input to the fault detection process is the original 3D seismic amplitude data. First, the data is put through several iterations of pre-conditioning, namely structurally-oriented filtering (SOF3D), to sharpen the discontinuities in the amplitude volume (Fehmers and Höcher, 2003). This data preconditioning especially helps to improve fault results for noisy datasets. Figure 6 shows output from three iterations of SOF3D for a key inline of the survey alongside the original amplitude and the noise rejected by the filter process. Several faults which have been sharpened are highlighted in the middle panel.
Next the conditioned amplitude data volume is inputted to the CNN algorithm (Ronneberger and others, 2015; Wu and others, 2019; Zhao and Mukhopadhyay, 2018; Qi and others, 2020). Two different U-net architecture models (‘engines’) operate on the data, conservative and aggressive, to detect the presence of faults in three dimensions. The conservative CNN model gives fewer false positives and mostly continuous faults whereas the aggressive model will highlight more discontinuities on seismic amplitude data, but the faults segments may be shorter and less continuous in 3D. The resulting CNN fault probability is then inputted to the post-processing step. The post-processing routines, termed fault enhancement and fault skeletonization, help to reduce false positives in the CNN output and make the detected faults more continuous. The fault enhancement and skeletonization steps apply Laplacian of Gaussian filtering (Qi and others, 2019) to the fault probability volume and utilize the inline and crossline dip component of the amplitude data from the SOF3D to improve the fault continuities and sharpen the fault edges from the original CNN fault probability volumes (Qi and others, 2017).
Fault detection results
Figure 7 shows amplitude depth slices within the reservoir by the fault probability ML results before and after post processing. This example shows results from the conservative CNN fault detection engine. It is apparent that the fault enhancement and skeletonization have sharpened the fault image and made faults more continuous. In addition, the complex fault geometries make a good case for using a 3D fault model instead of either a 2D model or an interpreter-trained fault engine.

Applying multi-attribute classifications to fault detection
The workflow described in Figure 5 does an excellent job in delineating faults on 3D seismic data. To improve on this process for interpretation purposes, a machine learning multi-attribute classification process can be applied called Self-Organizing Maps (SOM) (Kohonen 2001). SOM is an unsupervised non-linear neural network approach that can combine numerous seismic attributes to identify natural patterns and clusters in the data, especially stratigraphic relationships critical to interpreting fault systems. Typical seismic attribute volumes that may be inputted into SOM include instantaneous, spectral decomposition, inversion, and geometric attributes. Figure 8 illustrates the unsupervised learning process in SOM, which classifies multiple attributes in attribute space and maps the results to neurons associated with a two-dimensional colour map. Each neuron represents a classified pattern identified from all the data points from the multiple seismic attributes (Roden and others, 2015). Figure 9 denotes the workflow that incorporates the Deep Learning fault detection volume(s) into the SOM classification process.
nine attributes, through multi-attribute space, and
the resulting 2D coulormap.
(left) to faults isolation by neuron.
When the SOM process is applied for fault detection, the fault probability volume from CNN is classified along with the other seismic attributes, especially instantaneous attributes that are very good at defining stratigraphy, lithology and potentially rock properties. The most appropriate instantaneous attributes are routinely identified by Principal Component Analysis and represent the most prominent attributes in any 3D volume (Roden and others, 2015; Leal and others, 2019). It is this combining of instantaneous attributes with the fault volume in a SOM analysis that produces results that enhance the fault interpretation because it is incorporated with a typical output that defines detailed stratigraphy. This classification has advantages because the faults are now assigned to specific neurons making it straightforward to isolate and correlate the fault network. These neurons that classify the faults are called ‘fault neurons’, a new concept put forward by the authors.
Multi-attribute SOMs which included a combination of instantaneous and fault attributes were successful in further refining the fault interpretation over the field. The instantaneous attributes generated were from the full spectrum amplitude data defined by the top and base of the reservoir and an area of good signal-to-noise ratio.
Semi-supervised workflow results
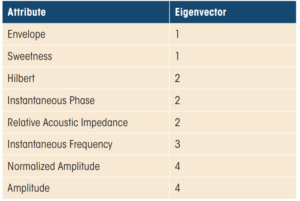
Instantaneous attributes generated for the original, full-spectrum amplitude data were inputted to a PCA using the top and base reservoir seismic horizons and selecting an area of good signal-to-noise ratio, away from the most faulted parts of the seismic volume. From an initial list of 16 attributes, 8 were used in the SOMs, along with several combinations of enhanced fault probability volumes.
Table 1 shows the instantaneous attributes and their associated Eigenvectors from PCA.

Several SOM topologies: 8×8, 10×10 and 12×12 yielded good results. For this case study, the focus will be on the results for the 8×8 topology. Figure 10 shows an inline comparison between an 8×8 SOM result and the filtered amplitude data used in the fault detection workflow. Note that none of the faults inferred by the SOM cut the reservoir zone completely.

faults from both aggressive and conservative CNN engines. Its 2D colourmap is shown in the lower left. The fault neurons have been coloured grey for emphasis. The image on the right is the pre-processed amplitude data used in the enhanced fault detection workflow. The approximate reservoir zone of interest is highlighted between the dashed lines.
Figure 11 shows a N-S inline from the same SOM as Figure 10, an 8×8 SOM which used multiple CNN engines and the filtered amplitude co-rendered with the two enhanced fault probability volumes at the more complicated west end of the survey, along with the original fault interpretation superimposed. Of particular interest are the faults below the top reservoir seismic horizon on the north end of the inline. These faults do not extend below the base reservoir seismic horizon which has implications for hydrocarbon migration, as the source rock is presumed to be below the reservoir zone.

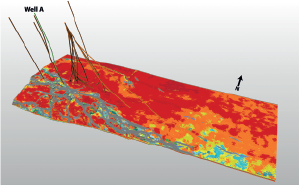
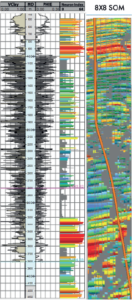
Figure 12 shows an 8×8 SOM sculpted over the reservoir interval which is one of the better producing reservoirs in the field. The faults from the SOM can be traced over the top of the interval and it is easy to see how this reservoir zone is potentially compartmentalized by the faults. The changes in neuron classification index away from the faults could be indicative of stratigraphic changes within the reservoir interval. The well highlighted in green (Well A) looks to be located very close to a fault so this well was compared to the seismic data extracted along the wellbore (Figure 13). The SOM suggests that the well crossed several faults and the well logs through these fault zones are both lower porosity and higher Vclay in general.
Conclusions
Before this project, the operator had tried conventional attribute-based methods to improve their fault interpretation. However, the results from these prior attempts at fault detection were inconclusive. The results from the project described above were successful in isolating major and minor faults within the 3D survey to a level of detail not previously achieved. The enhanced
fault detection workflow is reasonably quick to apply and can be used in any geologic setting as the case presented is on the far end of the scale for fault complexity. The key findings from this project are as follows:
- Using machine learning to automate fault detection was successful.
- Pre- and post-processing of the seismic data contributed positively to final fault probability volumes.
- The combined Supervised (CNN) and Unsupervised (SOM) ML technologies yield excellent results and can identify which wells encountered faults.
- SOM is useful in a complimentary stratigraphic analysis.
Overall, ML results assist in identifying the geometry of the faults visible in the seismic volume. The results are 3D seismic volumes that are easily exchanged with standard geomodeling packages and thus will aid in updating the reservoir structural model.
Acknowledgments
The authors would like to thank their colleagues at Geophysical Research, LLC (d/b/a Geophysical Insights) and acknowledge use of the Paradise software that was applied in the work. We also offer special thanks to the client for reviews, feedback and, permission to publish this study.
References
Fehmers, G. and Höcher, and C.F.W. [2003]. Fast structural interpretation with structure-oriented filtering: Geophysics, 68, 1286-1293.
Kohonen, T. [2001]. Self Organizing Maps. Third extended addition, Springer Series in Information Services, Vol. 30.
Leal, J., Jeronimo, R., Rada, F., Viloria, R. and Roden, R. [2019]. Net reservoir discrimination through multi-attribute analysis at single sample scale, First Break, 37, 77-86.
Qi, J., Lyu, B., Alali, A,. Machado, G., Hu, Y. and Marfurt, K.J. [2019]. Image processing of seismic attributes for automatic fault extraction: Geophysics, 84(1), O25-O37.
Qi, J., Machado, G. and Marfurt, K.J. [2017]. A workflow to skeletonize faults and stratigraphic features: Geophysics, 82, O57-O70.
Qi, J., Zhang, B., Zhou, H. and Marfurt, K.J.[2014]. Attribute expression of fault-controlled karst–Fort Worth Basin, TX: Interpretation, 2(3), SF91–SF110.
Qi, J., Lyu, B., Wu, X. and Marfurt, K.J. [2020]. Comparing convolutional neural networking and image processing seismic fault detection methods:90th Annual International Meeting, SEG, Expanded Abstracts, 1111-1115.
Radoil (Reel Power International Subsidiary) & Harris Pye Engineering, [2015]. Cheleken Contract Area Development, Caspian Sea, https://www.offshore-technology.com/projects/cheleken-contract-area-development-caspian-sea/.
Roden, R., Smith, T. and Sacrey, D. [2015]. Geologic pattern recognition from seismic attributes: Principal component analysis and self-organizing maps. Interpretation, B., SAE59-SAE83.
Ronneberger, O., Fischer, P.and Brox, T. [2015]. U-Net: Convolutional networks for biomedical image segmentation: International Conference on Medical Image Computing and Computer-Assisted Intervention, 234-241.
Van Dijk, J., Temitope Ajayi, A., Eid, T., Eldali, M., Ellen, H., Guney, H., Hashem, M., Knispel, R., Rouis, L. and Santoni, S. [2018]. An Integrated Geological Model for the Greater Cheleken Area Central Caspian Basin, Turkmenistan; Complex Synsedimentary Transcurrent Faulting and Compartmentalization in Plio-Pleistocene Clastic Reservoirs: presented at the Abu Dhabi International Petroleum Exhibition & Conference, https://doi.org/10.2118/192978-MS.
Wu, X., Liang, L., Shi, Y. and Fomel, S. [2019]. FaultSeg3D: Using synthetic data sets to train an end-to-end convolutional neural network for 3D seismic fault segmentation: Geophysics, 84, IM35-IM45.
Zhao, T. and P. Mukhopadhyay, [2018]. A fault-detection workflow using deep learning and image processing: 88th Annual International Meeting, SEG, Expanded Abstracts, 1966-1970.


