Detección De Contraste Litológico en El Jurásico Superior Oxfordiano (JSO) Mediante Inteligencia Artificial E Integración Multidisciplinaria.

Madaín Moreno, Esteban Martínez, Gustavo Mellín, Santiago Martínez, Fabián Rada, David Rodríguez, and Reinaldo Viloria | Published with permission: Congreso Mexicano del Petróleo, CMP2020_89 | November 2021

Resumen

El presente trabajo surge de la necesidad de entender los rasgos estructurales y estratigráficos del yacimiento Arenas del JSO, para la ubicación de nuevos pozos de desarrollo, ya que uno de los últimos pozos perforados, no logró llegar al yacimiento, por columna geológica imprevista; adicionalmente identificar si existe comunicación entre dos bloques del mismo yacimiento, por lo que se inició con el control de calidad de los datos, donde se analizaron diferentes volúmenes sísmicos e información de pozos. Se realizaron análisis multiatributos a la escala del intervalo de muestreo y tamaño de bin para detectar contrastes litológicos y diferenciar la distribución lateral y vertical de las facies sedimentarias. El espesor de la arena es similar al espesor de entonación o resolución sísmica vertical tradicional de un cuarto de la longitud de onda dominante. Los atributos analizados fueron: Amplitud, Bandwidth, Imaginary Part, Instantaneous Frequency, Relative Acoustic Impedance, Envelope, Envelope First Derivative, Envelope Second Derivative, Sweetness y Thin Bed Indicator, entre otros. El primer paso fue aplicar el Análisis de Componentes Principales (ACP) para identificar los atributos más contribuyentes y significativos en términos de varianza, para seleccionarlos como datos de entrada para la clasificación simultánea mediante un algoritmo de inteligencia artificial conocido como Mapas Auto Organizados (MAO). Mediante esta metodología se logró extraer más información del dato sísmico, se integraron los análisis petrofísicos, sedimentológicos y de yacimientos para determinar el sentido de la depositación de las arenas, sus límites verticales y laterales, así como las posibles zonas de riesgo y áreas de oportunidad para la mejor estrategia de desarrollo del campo.

Introducción

La roca almacén del área de estudio se subdivide en cinco unidades. Se han realizado diversos estudios para describir el proceso sedimentario; en el año 1991, se trazó una paleo línea de costa tomando como criterio arenas que no presentaran cementante, producto de un proceso de gran energía capaz de lavar, redondear y seleccionar los sedimentos, ubicándolos en una zona de playa y/o dunas. Además, se realizó un modelo sedimentológico que ubica al depósito dentro de un sistema de islas de barrera transgresiva. En 1994, se planteó que los alineamientos de los planos de estratificación definidos en los registros de imagen confirman que, en su mayoría, los cuerpos de arenisca tienen una gran similitud a los sistemas de dunas en ambientes eólicos y existe sedimentación de otros subambientes costeros tales como frente de playa, canales de marea, característicos de sistemas costeros. En 2012, se propuso que las arenas de interés se depositaron en un ambiente de tipo transicional propio de zonas costeras, dominado por las mareas y se llevó a cabo en un sistema transgresivo, constituyendo una alternancia rítmica de arenas y evaporitas, formando barras costeras que restringían la circulación de aguas dando lugar a la formación de cuencas evaporíticas. Para el presente trabajo, de manera integral, se efectuaron el análisis de electrofacies y el análisis de multiatributos sísmicos con enfoque en contrastes litológicos, para finalmente, ser realizados los mapas de facies, que sirvieron de guía para la estimación de propiedades dentro del modelo geocelular. Leal et al., (2019) demostraron cómo la aplicación de inteligencia artificial para el análisis multiatributos y la integración de información multidisciplinaria permitieron aumentar la certidumbre sobre el contraste litológico en un yacimiento petrolero.

Metodología y Resultados

En el presente trabajo se actualizó el modelo estratigráfico a partir de los registros geofísicos, específicamente, en los puntos más bajos de rayos Gamma (marcando el inicio de un patrón granodecreciente en sentido estratigráfico) o más altos (marcando el inicio de un patrón granocreciente en sentido estratigráfico).

En lo relacionado a la petrofísica, se generaron modelos de volumen de arcillosidad, porosidad, permeabilidad, saturación de agua, presión capilar-tipo de roca y mojabilidad, identificando los cortes petrofísicos necesarios para obtener el espesor neto y espesor neto impregnado.

Adicionalmente, se generaron mapas de electrofacies, así como de espesor bruto,
espesor neto, porosidad efectiva y permeabilidad, a partir de los resultados de la evaluación petrofísica, para finalmente generar los mapas de facies para cada nivel estratigráfico, soportados por el análisis multiatributos sísmicos que permitió definir con mayor certidumbre la extensión lateral y vertical de las facies sedimentarias.

Respecto al análisis dinámico del yacimiento, se realizaron análisis PVT, se validó su gradiente y su factor de recuperación, así como también se pronosticó la producción de la mitad de los pozos disponibles utilizando los datos del periodo inicial de flujo natural y se calcularon las reservas originales.

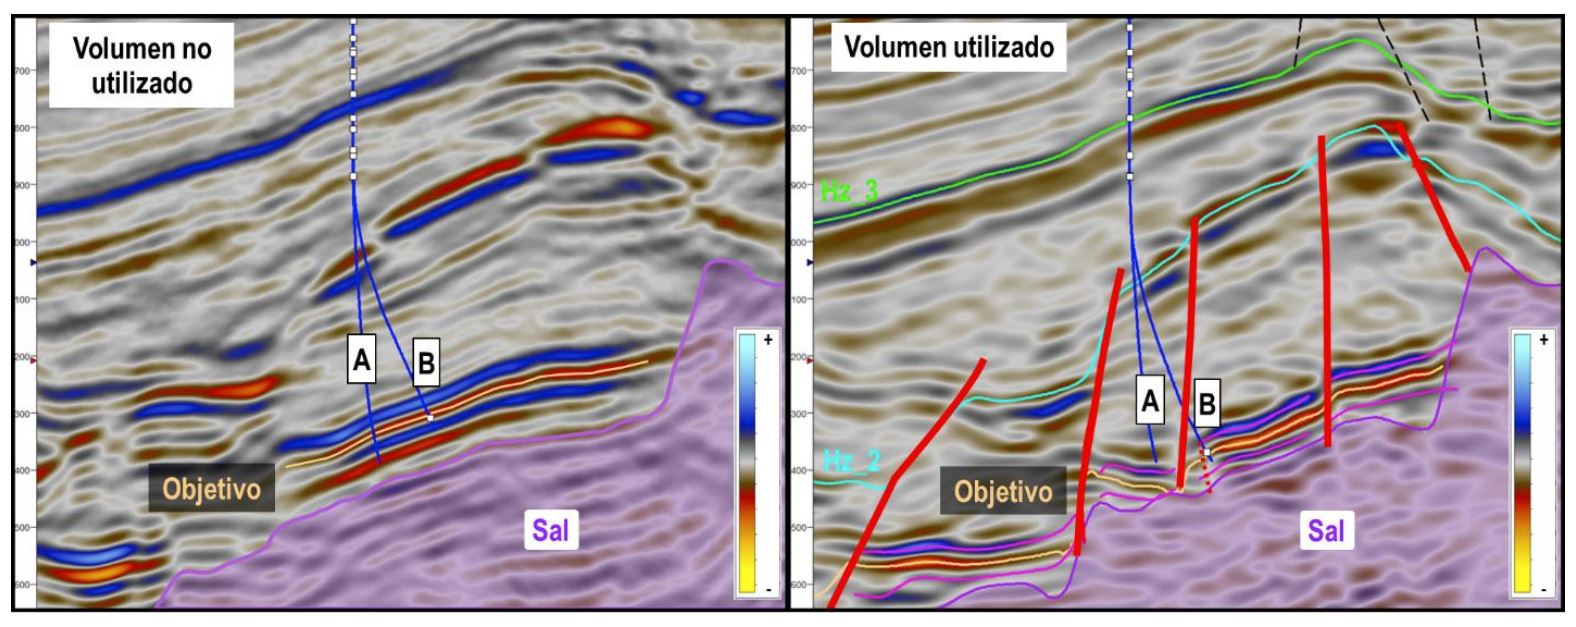
En lo relativo al modelo estructural, se realizó la revisión y control de calidad de seis (6) diferentes volúmenes sísmicos de amplitud, tanto en el dominio del tiempo como en profundidad, se generaron sismogramas sintéticos e interpretaron horizontes y fallas que permitieron ajustar el marco estructural. A la izquierda de la Figura 1, se observa una sección vertical, que incluye a los pozos A y B, propuestos con un volumen sísmico diferente al utilizado en este trabajo. Obsérvese que en este volumen no se logran definir las fallas que delimitan los bloques; el pozo A fue perforado encontrando un bloque bajo, producto de las fallas existentes y encontró una columna geológica imprevista mientras el pozo B fue perforado en el bloque alto, pero se mantuvo navegando de forma cercana y paralela al plano de falla (Figura 1, derecha) esto generó que no encontrara buena calidad de roca, resultando en pozos de nulo valor comercial. Además de interpretar los horizontes de interés, se hizo lo propio para niveles supra e infrayacentes donde se observaron cambios importantes de velocidades, que fueron ocupados para construir un modelo robusto de velocidades para llevar a cabo la conversión del dominio del tiempo a profundidad.

Figura 1. Sección sísmica transversal a la estructura mostrando la proyección de los pozos fallidos A y B (Izquierda: volumen no utilizado en el presente estudio. Derecha: volumen utilizado para ajustar el modelo estructural).

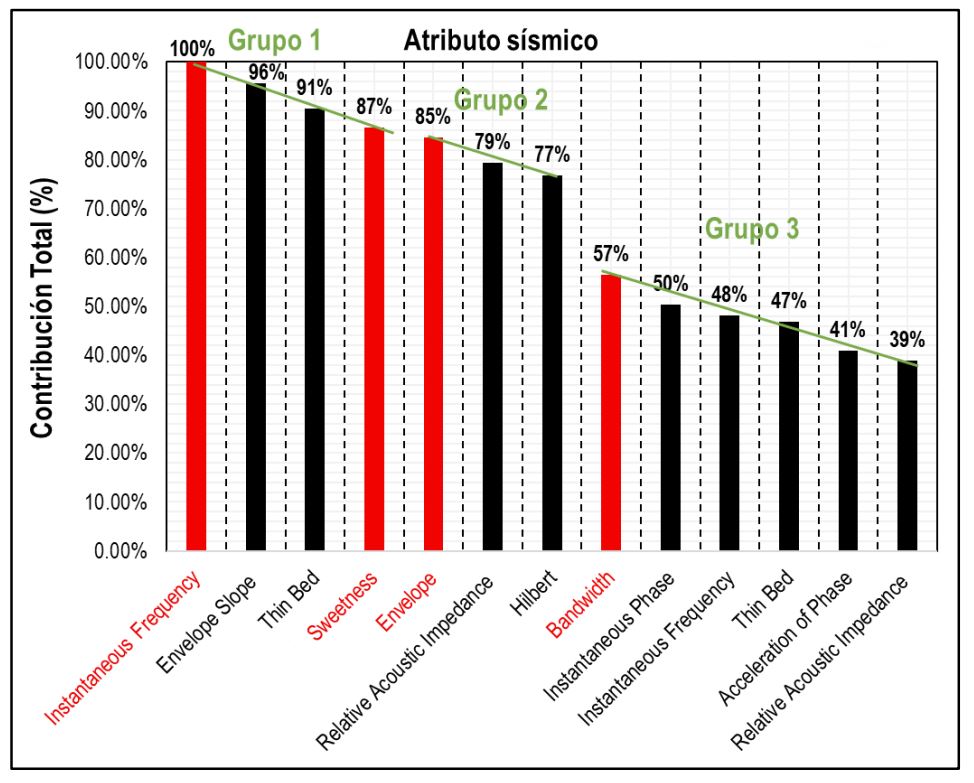
El paso siguiente fue la aplicación de la red neuronal con el algoritmo de Mapas Auto Organizados (MAO) para clasificar diferentes atributos sísmicos a la escala del voxel (12.5 metros por 35 metros e intervalo de muestreo igual a 2 milisegundos), que permitieron revelar agrupamientos por debajo del espesor de entonación. Previo a esto, se realizó el análisis de componentes principales (ACP) para identificar los atributos sísmicos más contribuyentes o significativos en términos de varianza. De un total de 13 atributos, se pudo obtener una lista ordenada de mayor a menor según el porcentaje de contribución total de cada atributo con la que se obtuvo el gráfico de la Figura 2.

Obsérvese que en la Figura 2, existen al menos tres grupos de atributos después que fueron ordenados, representados por líneas de tendencia de color verde: el primer grupo conformado por 4 atributos, el segundo por 3 atributos y, por último, el resto. Así pues, los atributos más contribuyentes son: el de mayor y menor contribución del grupo 1 y el de mayor contribución de los grupos 2 y 3, respectivamente (en ese orden: Instantaneous Frequency, Sweetness, Envelope y Bandwidth).

Figura 2. Gráfico de atributos sísmicos más contribuyentes según el ACP de contraste litológico.

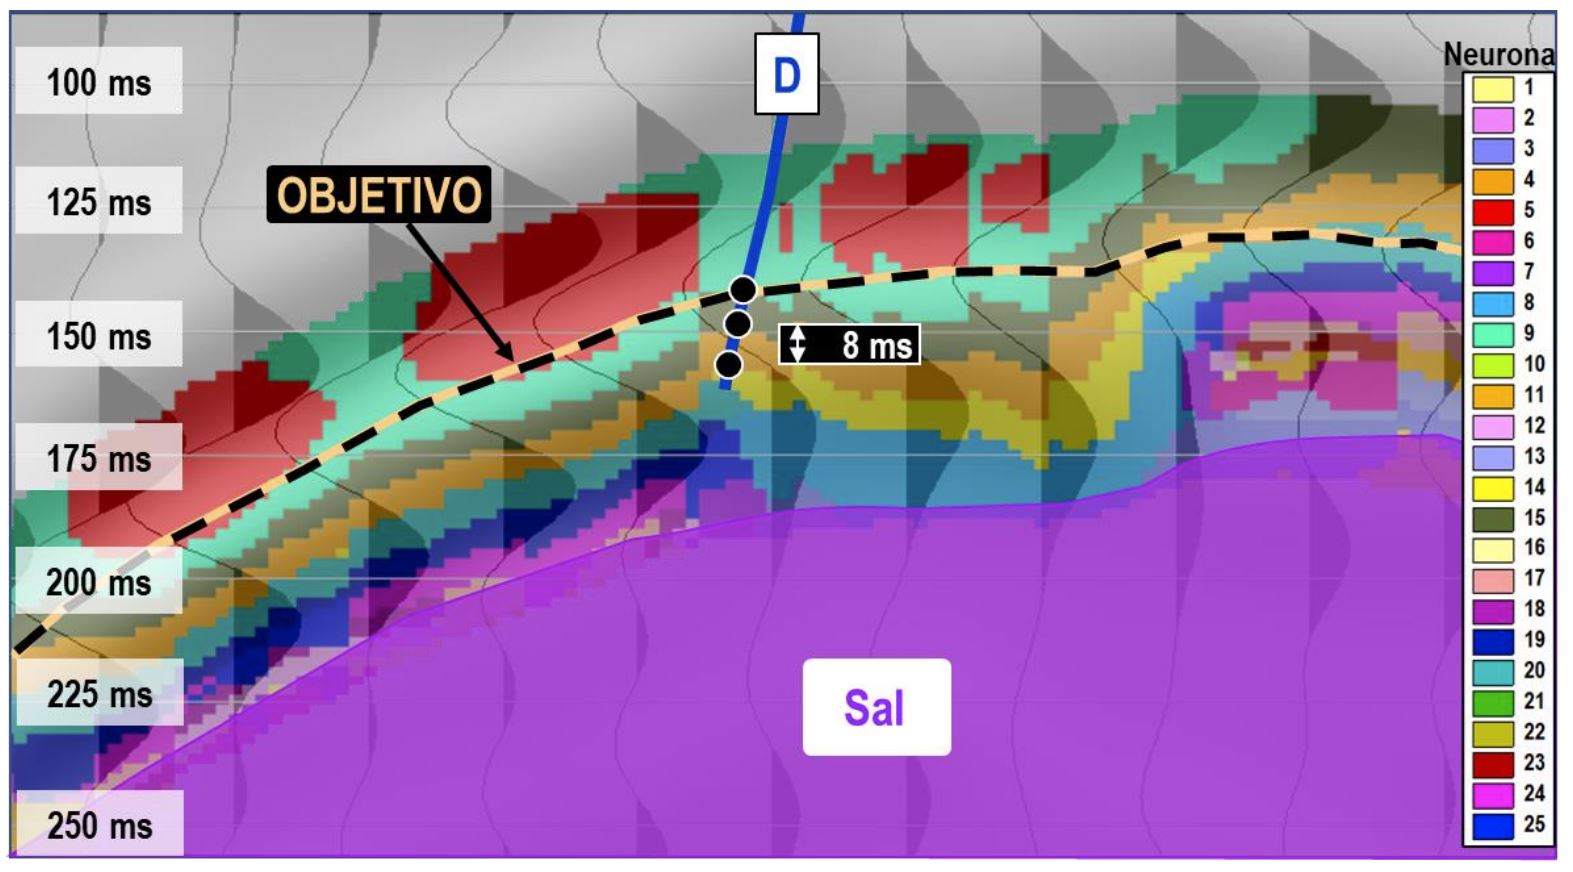
En la Figura 3, se muestra la clasificación MAO a la escala del intervalo de muestreo (2 milisegundos) de 25 valores discretos (neuronas) y mostrados con igual cantidad de colores. A su vez, están superpuestas las trazas de amplitud, en color negro. En el volumen MAO, se observan hacia la cima del yacimiento, los voxels agrupados por las neuronas N15 (verde olivo) y N4 (anaranjado) que corresponden a las dos unidades superiores del yacimiento, cuyos espesores están alrededor de los 20 metros cada una. Infrayaciendo a estas unidades, fueron agrupadas muestras que se asocian a otras unidades, que poseen, según datos de pozos, menor calidad de roca que las unidades suprayacentes, por ejemplo, las neuronas N14 y N20.

Figura 3. Sección vertical del volumen clasificado a la escala del voxel (en colores) y amplitud (en negro).

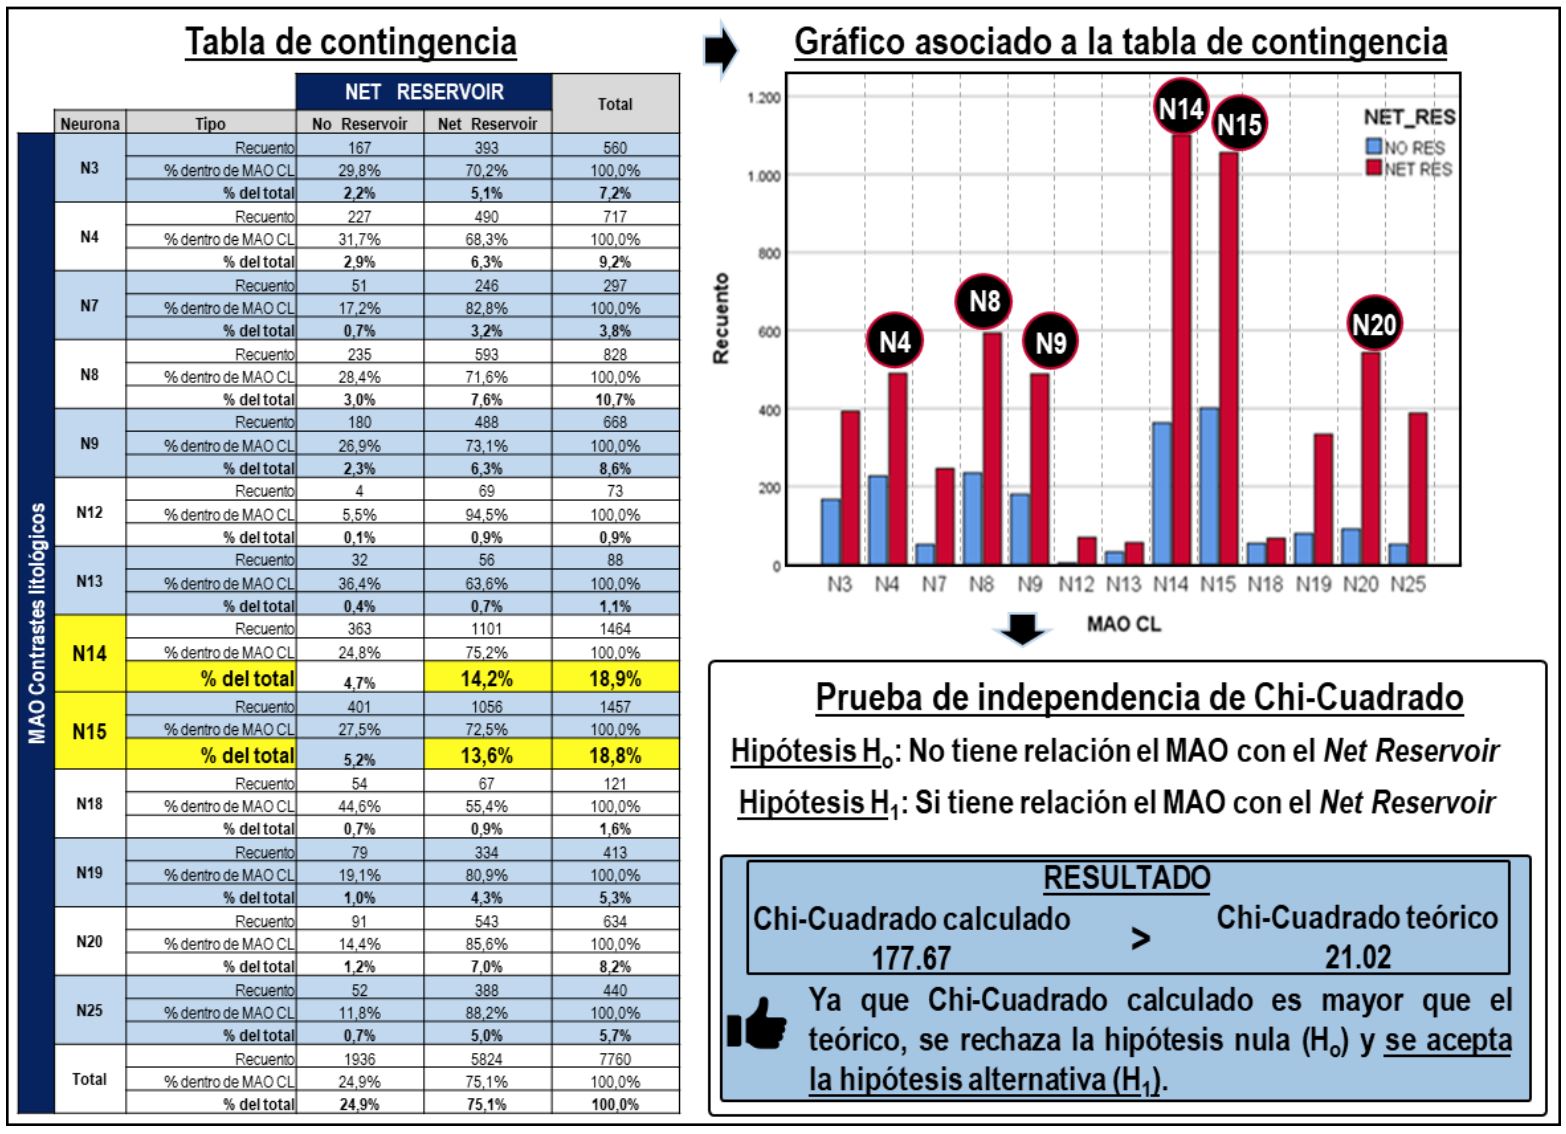
Luego se aplicó la prueba de independencia estadística Chi-Cuadrado a los pozos
disponibles en el área, para evaluar si existe o no relación entre dos variables categóricas (Leal et al., 2019), en primer lugar, entre la clasificación MAO de contraste litológico extraída a lo largo de las trayectorias y al intervalo de muestreo de los pozos (0.1524 m) y el registro discreto de la propiedad petrofísica Net Reservoir. Con esta prueba la hipótesis nula (Ho) establece que ambas variables son independientes y, por el contrario, la hipótesis alternativa (H1) establece que ambas variables están relacionadas, es decir, se puede explicar las neuronas del volumen MAO con la propiedad espesor neto (Net Reservoir). En la Figura 4, se muestran la tabla de contingencia y su gráfica de barras, herramientas con las que se analizó que las neuronas con mayor recuento en los pozos analizados y que responden en un mayor porcentaje a la categoría Net Reservoir son las neuronas N14 y N15, aunque hay otras neuronas que también presentan importancia como lo son la neurona N8, N20, N9 y N4. Finalmente, se observa que el valor de Chi-Cuadrado calculado es mayor que el valor teórico, por lo tanto, se acepta la hipótesis alternativa estableciéndose que las variables si están relacionadas.

Figura 4. Tabla de contingencia y Prueba de Chi-Cuadrado de las variables categóricas MAO de contraste litológico y Net Reservoir.

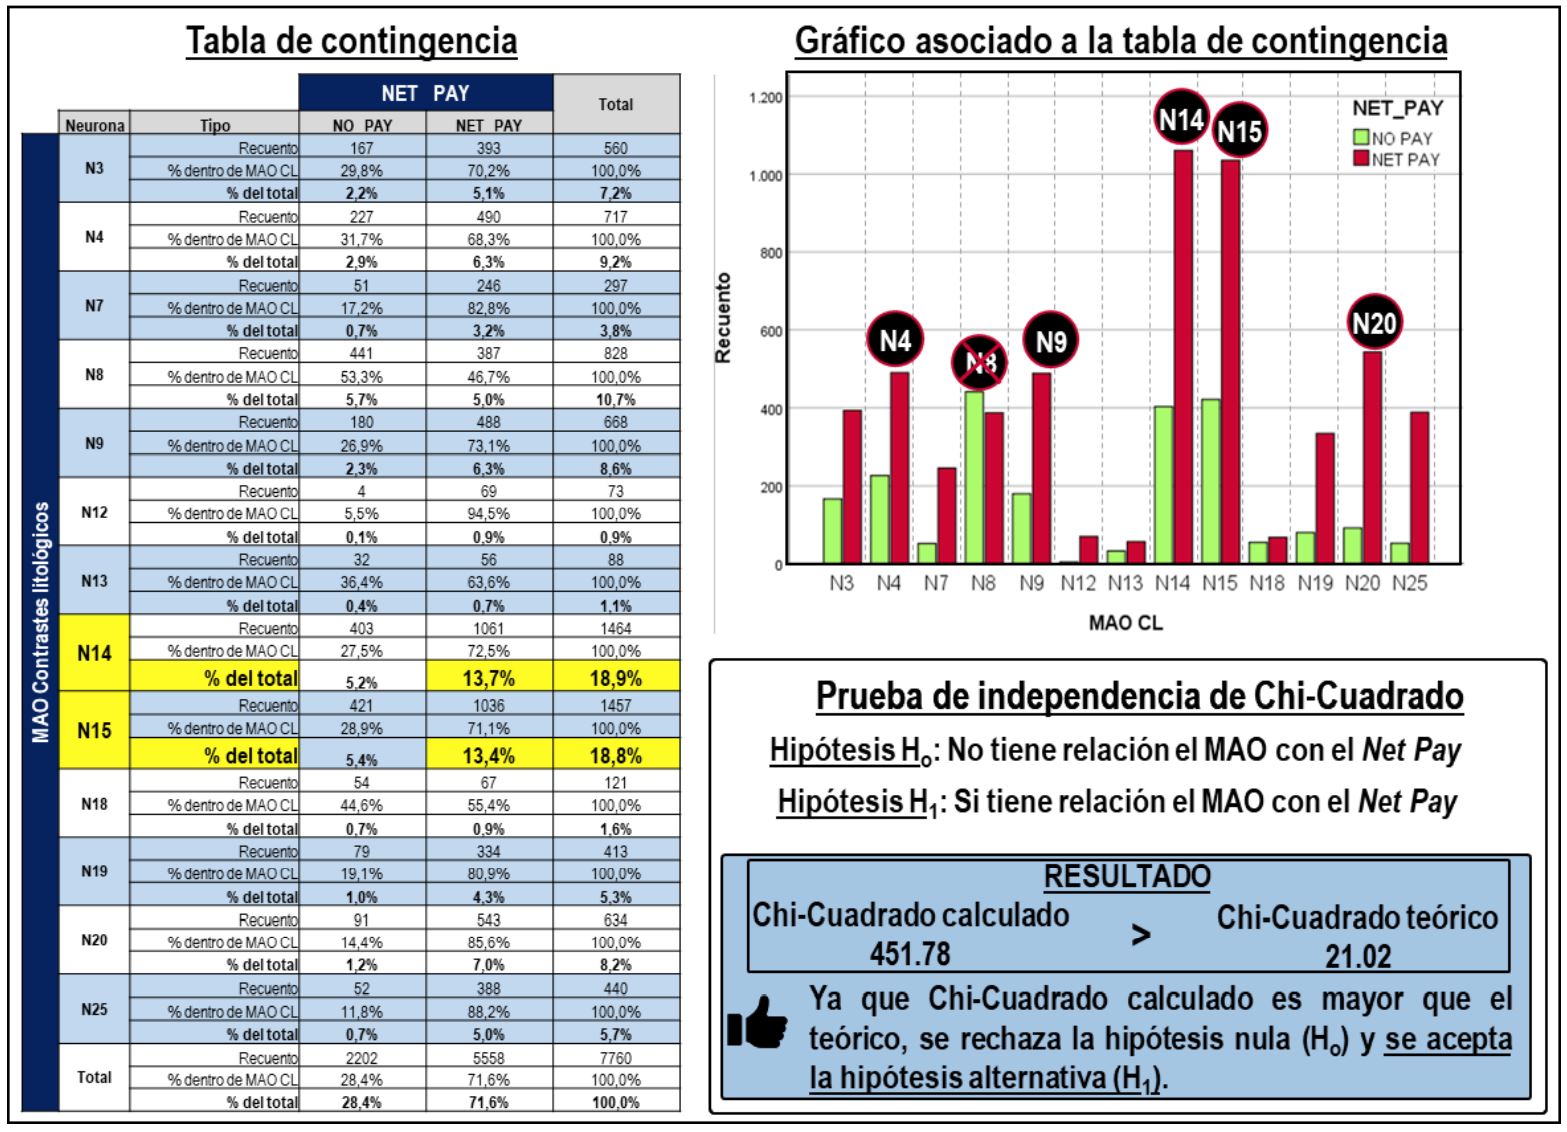
Es importante destacar, que, aunque el enfoque del MAO generado principalmente busca analizar los contrastes litológicos, no se descarta que el MAO responda a posible presencia de fluidos, puesto que los atributos clasificados son frecuentemente utilizados para tratar de observar cambios en la frecuencia y ancho de banda de la señal sísmica que pudieran relacionarse con acumulaciones de hidrocarburos. Con base en esto, se realizó el análisis de tabla de contingencia y la prueba de Chi-Cuadrado (Figura 5) para estimar la relación entre la variable categórica clasificación MAO y el registro discreto de la propiedad petrofísica espesor neto impregnado (Net Pay). El resultado muestra que las neuronas N14 y N15, tienen el mayor recuento de la categoría Net Pay y, por ende, se asocian a la roca impregnada de aceite. Es notable que la neurona N8, que presentaba un alto recuento de espesor neto (Net Reservoir) (ver Figura 4) ya no respondió bien al Net Pay, esto es porque dicha neurona se relaciona a las unidades más profundas del yacimiento cuyos valores de saturación de agua son más altos que el valor de corte, esto significa que tiene capacidad de almacenamiento, pero no contiene aceite.

Figura 5. Tabla de contingencia y Prueba de Chi-Cuadrado de las variables categóricas MAO de contraste litológico y la propiedad espesor neto (Net Pay).

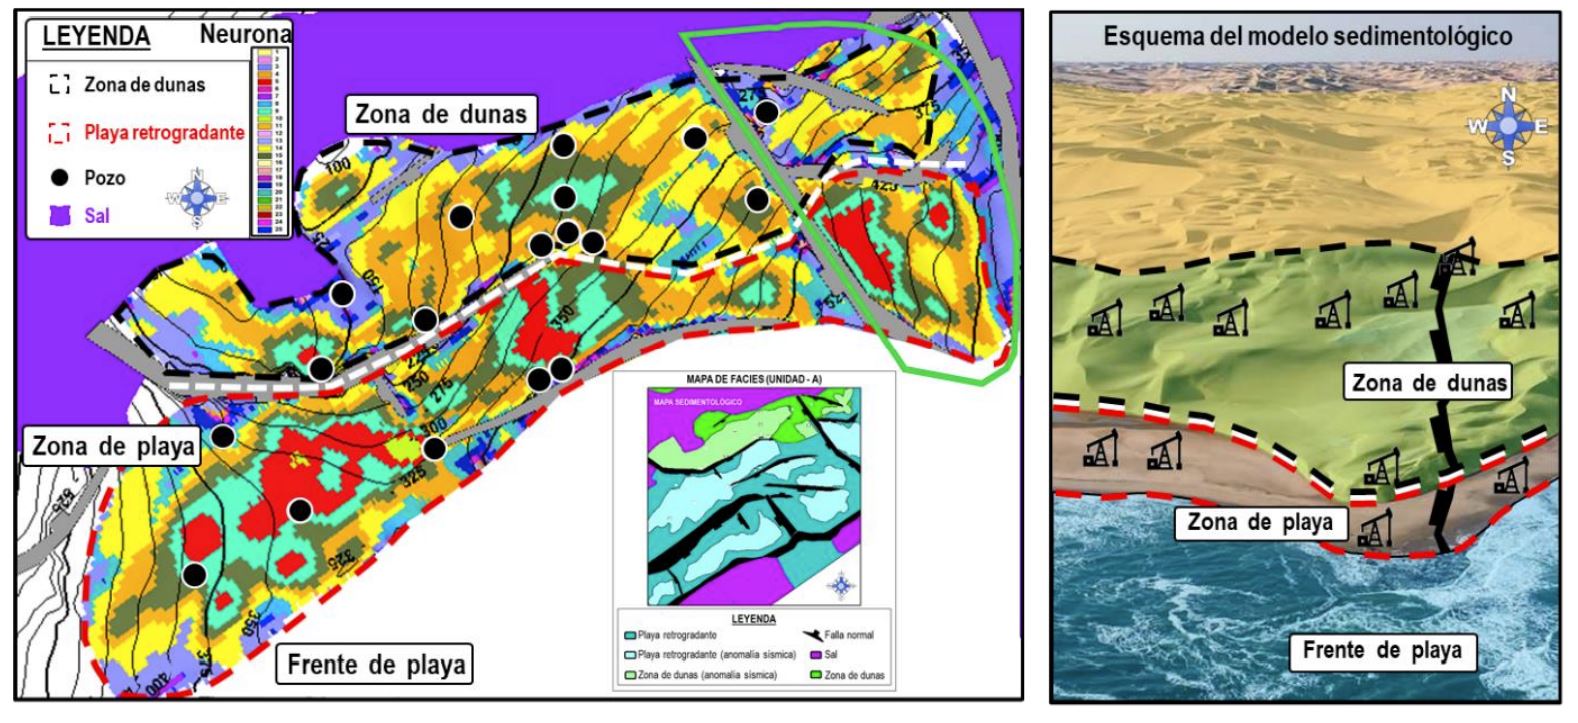
Con ayuda del volumen de clasificación MAO de contraste litológico fue posible definir la geometría de las facies en los mapas que conformaron el modelo sedimentológico para cada unidad. En la parte izquierda de la Figura 6, se muestra la vista en planta de un mapa con la clasificación MAO a la cima del horizonte sísmico, con la que se definieron dos tendencias, la primera de ellas al norte, corresponde a la zona de dunas que, de manera general, tiene mejores propiedades de roca que el resto de las facies, mientras que la segunda tendencia corresponde a la zona de playa, dentro del polígono punteado de color rojo. Los diferentes estudios sedimentológicos realizados para definir los
ambientes de depósito en el área de estudio coinciden en que las unidades se
depositaron en ambientes costeros. En la parte derecha de la figura, se observa un esquema simplificado del modelo sedimentológico análogo, en el que se muestran áreas con las facies identificadas y la posición relativa de los pozos.

Adicionalmente, a partir de estos resultados se delimitó la geometría del bloque al este del mapa, la cual no había sido previamente conceptualizada. En el área de estudio los resultados permitieron detectar cinco (5) áreas de oportunidad, de las cuales dos (2) no habían sido identificadas, que podrían ayudar a mantener o aumentar la producción de aceite.

Figura 6. MAO de contraste litológico y su uso en la elaboración del modelo sedimentológico.

Conclusiones

El presente trabajo permitió ajustar el marco estructural en áreas donde anteriormente no se habían definido fallas en las cercanías de pozos que fueron perforados y encontraron columna geológica imprevista. Adicionalmente, se comprobó por datos estáticos y dinámicos que los bloques norte y sur están comunicados. El análisis de componentes principales (ACP) sirvió para identificar y seleccionar los atributos sísmicos más contribuyentes en términos de varianza. Con la clasificación simultánea de cuatro atributos sísmicos, a la escala del intervalo de muestreo, mediante la red neuronal MAO se logró delimitar la extensión lateral y vertical de las unidades del yacimiento, bajo un enfoque de integración multidisciplinaria que incluyó petrofísica, sedimentología, estratigrafía, geofísica e ingeniería de yacimientos, que permitió aumentar la certidumbre sobre la extensión lateral y vertical del yacimiento.

Agradecimientos

Al equipo de trabajo de PEP y Petroleum Oil & Gas Services, Inc., por proveer los recursos técnicos utilizados y a Geophysical Research, LLC (d/b/a Geophysical Insights), por proveer el software Paradise®.

Referencias

Leal, J., R. Jerónimo, F. Rada, R. Viloria y R. Roden (2019). “Net reservoir discrimination through multi-attribute analysis at single sample scale”. First Break, v 37, No. 9, p. 77-86.

Roden, R., & Sacrey, D. (2016). Seismic Interpretation with Machine Learning. GeoExpro, 50-53.

Trayectoria profesional del autor y coautores:

Madaín Moreno Vidal es egresado del Instituto Politécnico Nacional como Ing. Geofísico, con 25 años de experiencia como Intérprete sísmico y líder de Geociencias en Activos de Producción de la Región Marina Noreste, ha sido autor de varios descubrimientos de campos como oportunidad exploratoria y bloques aledaños en campos en producción. Su experiencia abarca desde la detección y generación de localizaciones exploratorias hasta la estrategia en desarrollo y explotación de campos. Adicionalmente, participó como Asesor Sísmico en Rio de Janeiro (2008-2010), y fue Líder Nacional de Interpretación Sísmica (2010). Actualmente es Líder de Caracterización Estática de Yacimientos del Proyecto Ek-Balam.

Esteban Martínez es Ingeniero Geólogo, egresado de la Universidad Autónoma de San Luis Potosí, con 19 años de experiencia en la industria petrolera. Trabajó como geólogo de pozo durante 9 años en pozos marinos exploratorios delimitadores y de desarrollo. Se ha desempeñado en el Grupo VCD del Activo de Producción Cantarell (2010-2015), enla Coordinación de Geociencias en el área de Geomodelado (2015-2017), y desde el 2017 al presente como parte del Grupo de Geología de Explotación en el Grupo Ek Balam, dando seguimiento a las perforaciones y participando en la toma de decisiones operativas.

Gustavo Mellín es Ing. Geólogo; egresado de la Universidad Autónoma de Guerrero en el año 2000. Realizó trabajos de estratigrafía y sedimentología (2000-2003) en pozos de explotación de Gas (Norte del País) y pozos de aceite (Zona Sur y Zona Marina). En 2003 ingresó a PEMEX al Depto. Operación Geológica (RMSO), en el control estratigráfico de pozos exploratorios. En 2005 se integró a Prospectos y Caracterización Inicial del APC realizando análisis petrográficos-diagenéticos y estratigráficos. Cuenta con 3 diplomados en su trayectoria en Petróleos Mexicanos. Actualmente se desempeña como líder del grupo de Sedimentología y Estratigrafía del Activo de Producción Cantarell.

Santiago Martínez es Ing. Geólogo egresado de la Universidad Autónoma de Nuevo León (2013). De 2013 a 2014 trabajó en el norte del país realizando el seguimiento geológico-operativo de pozos de gas. En 2015 ingresó a PEMEX, al APC en el área de Sedimentología, desarrollando actividades de control estratigráfico de pozos de desarrollo, actualización de los modelos sedimentarios y correlaciones estratigráficas y estructurales de seguimiento a pozos. Desde el 2017 al presente se desempeña como Geólogo Intérprete en el Grupo Ek-Balam donde realiza trabajos de VCD y seguimiento operativo de pozos de desarrollo y es miembro activo de la AMGP.

Fabián Rada tiene 14 años de experiencia en las áreas de interpretación sísmica, incorporando técnicas como Análisis de Componentes Principales, redes neuronales para análisis multi atributos sísmicos, Descomposición Espectral, “RGB visual blending” de atributos y extracción de geocuerpos, como parte de flujos de trabajo desarrollados para la caracterización de yacimientos de hidrocarburos. Previamente, trabajó en Funvisis, CNPC Daqing de Venezuela y PDVSA Sísmica Bielovenezolana. El Sr. Rada tiene experiencia en la adquisición, procesamiento e interpretación de datos sísmicos de reflexión y refracción, gravimétricos y magnéticos. Recibió el título de Ingeniero Geofísico de la Universidad Central de Venezuela.

David Rodríguez es Ingeniero Geofísico egresado de la Universidad Autónoma de Nuevo León, cuenta con más de 13 años de experiencia en la industria petrolera desempeñándose como interprete sísmico con diferentes herramientas enfocadas en el análisis de multiatributos sísmicos por medio de redes neuronales no-supervisadas, además cuenta con experiencia en análisis AVO (modelado e interpretación), inversión sísmica y manejando la herramienta de propagación de propiedades petrofísicas mediante redes neuronales supervisadas. También ha trabajado como analista Geofísico Senior en procesamiento sísmico en tiempo y profundidad y se ha desempeñado comoanalista de control de calidad de adquisición sísmica 3D terrestre.

Reinaldo Viloria es Director de Petroleum Oil & Gas Services, Inc., con 30 años de experiencia en la industria petrolera, liderando y gerenciando diversos proyectos complejos en Exploración y Producción. Su experiencia incluye investigación, desarrollo de metodologías y aplicación de técnicas geoestadísticas para la caracterización de yacimientos en Venezuela, México, Argentina, Colombia, África, EE. UU. y Canadá. Dominio en la integración de información multidisciplinaria. El Sr. Viloria tiene una Especialización en Modelado y Caracterización de Yacimientos del Imperial College of London y del French Institute of Petroleum en Paris y una licenciatura en Matemáticas de la Universidad Central de Venezuela.

Summary

The present work arises from the need to understand the structural and stratigraphic features of the Arenas del JSO deposit, for the location of new development wells, since one of the last wells drilled, failed to reach the deposit, due to unforeseen geological column; additionally identify if there is communication between two blocks of the same reservoir, so it began with the quality control of the data, where different seismic volumes and well information were analyzed. Multi-attribute analyses were performed on the scale of the sampling interval and bin size to detect lithological contrasts and differentiate the lateral and vertical distribution of sedimentary facies. The thickness of the sand is similar to the traditional intonation thickness or vertical seismic resolution of a quarter of the dominant wavelength. The attributes analyzed were: Amplitude, Bandwidth, Imaginary Part, Instantaneous Frequency, Relative Acoustic Impedance, Envelope, Envelope First Derivative, Envelope Second Derivative, Sweetness and Thin Bed Indicator, among others. The first step was to apply Principal Component Analysis (PCA) to identify the most contributing and significant attributes in terms of variance, to select them as input data for simultaneous classification using an artificial intelligence algorithm known as Self-Organized Maps (MAO). Through this methodology it was possible to extract more information from the seismic data, petrophysical, sedimentological and reservoir analyses were integrated to determine the direction of the deposit of the sands, their vertical and lateral limits, as well as the possible risk zones and areas of opportunity for the best development strategy of the field.

Introduction

The storage rock of the study area is subdivided into five units. Several studies have been carried out to describe the sedimentary process; in 1991, a paleo coastline was drawn taking as a criterion sands that did not present cementitious, product of a process of great energy capable of washing, rounding and selecting the sediments, placing them in an area of beach and / or dunes. In addition, a sedimentological model was made that locates the deposit within a system of transgressive barrier islands. In 1994, it was proposed that the alignments of the stratification planes defined in the image records confirm that, for the most part, sandstone bodies have a great similarity to dune systems in wind environments and there is sedimentation of other coastal subenvironments such as beach front, tidal channels, characteristic of coastal systems. In 2012, it was proposed that the sands of interest were deposited in a transitional environment typical of coastal areas, dominated by tides and was carried out in a transgressive system, constituting a rhythmic alternation of sands and evaporites, forming coastal bars that restricted the circulation of waters giving rise to the formation of evaporitic basins. For the present work, in an integral way, the analysis of electrofaces and the analysis of seismic multiattributes with a focus on lithological contrasts were carried out, to finally, the facies maps were made, which served as a guide for the estimation of properties within the geocellular model. Leal et al., (2019) demonstrated how the application of artificial intelligence for multi-attribute analysis and the integration of multidisciplinary information allowed to increase the certainty about the lithological contrast in an oil field.

Methodology and Results

In the present work, the stratigraphic model was updated from the geophysical records, specifically, at the lowest points of Gamma rays (marking the beginning of a grain-decreasing pattern in the stratigraphic sense) or higher (marking the beginning of a grain-increasing pattern in the stratigraphic sense).

In relation to petrophysics, models of clay volume, porosity, permeability, water saturation, capillary pressure-type of rock and wettability were generated, identifying the petrophysical cuts necessary to obtain the net thickness and net thickness impregnated.

Additionally, maps of electrofaces were generated, as well as gross thickness,
net thickness, effective porosity and permeability, from the results of the petrophysical evaluation, to finally generate the facies maps for each stratigraphic level, supported by the seismic multi-attribute analysis that allowed to define with greater certainty the lateral and vertical extension of the sedimentary facies.

Regarding the dynamic analysis of the reservoir, PVT analysis was performed, its gradient and recovery factor were validated, as well as the production of half of the available wells was forecast using data from the initial period of natural flow and the original reserves were calculated.

Regarding the structural model, the review and quality control of six (6) different seismic volumes of amplitude was carried out, both in the time domain and in depth, synthetic seismograms were generated and horizons and failures were interpreted that allowed to adjust the structural framework. To the left of Figure 1, a vertical section is observed, which includes wells A and B, proposed with a seismic volume different from that used in this work. Note that in this volume it is not possible to define the faults that delimit the blocks; well A was drilled finding a low block, product of existing faults and found an unforeseen geological column while well B was drilled in the high block, but it remained navigating closely and parallel to the fault plane (Figure 1, right) this generated that it did not find good quality of rock, resulting in wells of zero commercial value. In addition to interpreting the horizons of interest, the same was done for supra and infralysing levels where important changes in velocities were observed, which were used to build a robust model of velocities to carry out the conversion of the time domain to depth.

Figure 1. Seismic section transverse to the structure showing the projection of failed wells A and B (Left: volume not used in the present study. Right: Volume used to adjust the structural model).

The next step was the application of the neural network with the Self-Organized Maps (MAO) algorithm to classify different seismic attributes at the voxel scale (12.5 meters by 35 meters and sampling interval equal to 2 milliseconds), which allowed to reveal clusters below the intonation thickness. Prior to this, principal component analysis (PCA) was performed to identify the most contributing or significant seismic attributes in terms of variance. From a total of 13 attributes, it was possible to obtain an ordered list from highest to lowest according to the percentage of total contribution of each attribute with which the graph in Figure 2 was obtained.

Note that in Figure 2, there are at least three groups of attributes after they were sorted, represented by green trend lines: the first group consisting of 4 attributes, the second by 3 attributes, and finally the rest. Thus, the most contributing attributes are: the highest and lowest contribution of group 1 and the highest contribution of groups 2 and 3, respectively (in that order: Instantaneous Frequency, Sweetness, Envelope and Bandwidth).

Figure 2. Graph of most contributing seismic attributes according to the ACP of lithological contrast.

Figure 3 shows the MAO classification at the scale of the sampling interval (2 milliseconds) of 25 discrete values (neurons) and shown with equal amount of colors. In turn, the traces of amplitude are superimposed, in black. In the MAO volume, the voxels grouped by neurons N15 (olive green) and N4 (orange) that correspond to the two upper units of the deposit, whose thicknesses are around 20 meters each, are observed towards the top of the site. Infralysing these units, samples were grouped that are associated with other units, which have, according to well data, lower rock quality than the overlying units, for example, neurons N14 and N20.

Figure 3. Vertical section of the volume rated at the voxel scale (in colors) and amplitude (in black).

Then the Chi-Square statistical independence test was applied to the wells available in the area, to evaluate whether or not there is a relationship between two categorical variables (Leal et al., 2019), firstly, between the MAO classification of lithological contrast extracted along the trajectories and the sampling interval of the wells (0.1524 m) and the discrete record of the Net Reservoir petrophysical property. With this test the null hypothesis (Ho) establishes that both variables are independent and, on the contrary, the alternative hypothesis (H1) establishes that both variables are related, that is, the neurons of the MAO volume can be explained with the net thickness property (Net Reservoir). In Figure 4, the contingency table and its bar graph are shown, tools with which it was analyzed that the neurons with the highest count in the wells analyzed and that respond in a greater percentage to the Net Reservoir category are the neurons N14 and N15, although there are other neurons that also present importance such as the N8 neuron, N20, N9 and N4. Finally, it is observed that the calculated Chi-Square value is greater than the theoretical value, therefore, the alternative hypothesis is accepted establishing that the variables are related.

Figure 4. Contingency table and Chi-Square test of the categorical variables MAO of lithological contrast and Net Reservoir.

It is important to note that, although the mao approach generated mainly seeks to analyze lithological contrasts, it is not ruled out that the MAO responds to the possible presence of fluids, since the classified attributes are frequently used to try to observe changes in the frequency and bandwidth of the seismic signal that could be related to accumulations of hydrocarbons. Based on this, the contingency table analysis and the Chi-Square test (Figure 5) were performed to estimate the relationship between the categorical variable MAO classification and the discrete record of the petrophysical property impregnated net thickness (Net Pay). The result shows that neurons N14 and N15 have the highest count in the Net Pay category and, therefore, are associated with oil-impregnated rock. It is notable that the N8 neuron, which had a high net thickness count (See Figure 4) no longer responded well to Net Pay, this is because this neuron is related to the deeper units of the reservoir whose water saturation values are higher than the cut-off value, this means that it has storage capacity, but it does not contain oil.

Figure 5. Contingency table and Chi-Square test of the MAO categorical variables of lithological contrast and the net thickness property (Net Pay).

With the help of the MAO classification volume of lithological contrast it was possible to define the geometry of the facies in the maps that formed the sedimentological model for each unit. In the left part of Figure 6, the plan view of a map with the MAO classification at the top of the seismic horizon is shown, with which two trends were defined, the first of them to the north, corresponds to the dune area that, in general, has better rock properties than the rest of the facies, while the second trend corresponds to the beach area, within the dotted red polygon. The different sedimentological studies carried out to define the deposit environments in the study area agree that the units were deposited in coastal environments. On the right side of the figure, a simplified scheme of the analogous sedimentological model is observed, in which areas with the identified facies and the relative position of the wells are shown.

Additionally, from these results the geometry of the block to the east of the map was delimited, which had not been previously conceptualized. In the study area, the results allowed to detect five (5) areas of opportunity, of which two (2) had not been identified, which could help maintain or increase oil production.

Figure 6. MAO of lithological contrast and its use in the elaboration of the sedimentological model.

Conclusions

The present work allowed to adjust the structural framework in areas where previously no faults had been defined in the vicinity of wells that were drilled and found unforeseen geological column. Additionally, it was verified by static and dynamic data that the northern and southern blocks are communicated. Principal component analysis (PCA) served to identify and select the most contributing seismic attributes in terms of variance. With the simultaneous classification of four seismic attributes, at the scale of the sampling interval, through the MAO neural network it was possible to delimit the lateral and vertical extension of the reservoir units, under a multidisciplinary integration approach that included petrophysics, sedimentology, stratigraphy, geophysics and reservoir engineering, which allowed to increase certainty about the lateral and vertical extension of the deposit.

Acknowledgements

To the team of PEP and Petroleum Oil & Gas Services, Inc., for providing the technical resources used and to Geophysical Research, LLC (d/b/a Geophysical Insights), for providing the Paradise® software.

References

Leal, J., R. Jerónimo, F. Rada, R. Viloria and R. Roden (2019). “Net reservoir discrimination through multi-attribute analysis at single sample scale”. First Break, v 37, No. 9, p. 77-86.

Roden, R., & Sacrey, D. (2016). Seismic Interpretation with Machine Learning. GeoExpro, 50-53.

Professional career of the author and co-authors:

Madaín Moreno Vidal is a graduate of the National Polytechnic Institute as a Geophysical Engineer, with 25 years of experience as a seismic interpreter and leader of Geosciences in Production Assets of the Northeast Marine Region, he has been the author of several discoveries of fields such as exploratory opportunity and surrounding blocks in fields in production. His experience ranges from the detection and generation of exploratory locations to the strategy in development and exploitation of fields. Additionally, he participated as Seismic Advisor in Rio de Janeiro (2008-2010), and was National Leader of Seismic Interpretation (2010). He is currently Leader of Static Characterization of Deposits of the Ek-Balam Project.

Esteban Martínez is a Geologist Engineer, graduated from the Autonomous University of San Luis Potosí, with 19 years of experience in the oil industry. He worked as a well geologist for 9 years in exploratory delimiter and development marine wells. He has worked in the VCD Group of the Cantarell Production Asset (2010-2015), in the Geosciences Coordination in the Geomodeling area (2015-2017), and from 2017 to the present as part of the Exploitation Geology Group in the Ek Balam Group, monitoring drilling and participating in operational decision-making.

Gustavo Mellín is a Geologist; graduated from the Autonomous University of Guerrero in 2000. He carried out stratigraphy and sedimentology work (2000-2003) in gas exploitation wells (North of the Country) and oil wells (South Zone and Marine Zone). In 2003 he joined PEMEX to the Geological Operation Department (RMSO), in the stratigraphic control of exploratory wells. In 2005 he joined prospectuses and Initial Characterization of the APC performing petrographic-diagenetic and stratigraphic analyses. He has 3 diplomas in his career at Petróleos Mexicanos. He currently serves as leader of the Sedimentology and Stratigraphy group of the Cantarell Production Asset.

Santiago Martínez is a Geologist graduated from the Autonomous University of Nuevo León (2013). From 2013 to 2014 he worked in the north of the country carrying out the geological-operational monitoring of gas wells. In 2015 he joined PEMEX, the APC in the area of Sedimentology, developing activities of stratigraphic control of development wells, updating of sedimentary models and stratigraphic and structural correlations of monitoring wells. From 2017 to the present he works as an Interpreter Geologist in the Ek-Balam Group where he performs VCD work and operational monitoring of development wells and is an active member of the AMGP.

Fabián Rada has 14 years of experience in the areas of seismic interpretation, incorporating techniques such as Principal Component Analysis, neural networks for seismic multi-attribute analysis, Spectral Decomposition, “RGB visual blending” of attributes and geobody extraction, as part of workflows developed for the characterization of hydrocarbon deposits. Previously, he worked at Funvisis, CNPC Daqing of Venezuela and PDVSA Seismic Bielovenezolana. Mr. Rada has experience in the acquisition, processing and interpretation of seismic reflection and refraction, gravimetric and magnetic data. He received the title of Geophysical Engineer from the Central University of Venezuela.

David Rodríguez is a Geophysical Engineer graduated from the Autonomous University of Nuevo León, has more than 13 years of experience in the oil industry working as a seismic interpreter with different tools focused on the analysis of seismic multi-attributes through unsupervised neural networks, also has experience in AVO analysis (modeling and interpretation), seismic investment and handling the tool of propagation of petrophysical properties through networks supervised neuronals. He has also worked as a Senior Geophysical Analyst in time and depth seismic processing and has served as a quality control analyst for terrestrial 3D seismic acquisition.

Reinaldo Viloria is Director of Petroleum Oil & Gas Services, Inc., with 30 years of experience in the oil industry, leading and managing various complex projects in Exploration and Production. His experience includes research, development of methodologies and application of geostatistical techniques for the characterization of deposits in Venezuela, Mexico, Argentina, Colombia, Africa, USA and Canada. Mastery in the integration of multidisciplinary information. Mr. Viloria holds a Specialization in Reservoir Modeling and Characterization from Imperial College london and the French Institute of Petroleum in Paris and a bachelor’s degree in Mathematics from the Central University of Venezuela.

OR

Request access by filling the form below to download full PDF.
Name(Required)
Most Popular Papers
Case Study: An Integrated Machine Learning-Based Fault Classification Workflow
Using machine learning to classify a 100-square-mile seismic volume in the Niobrara, geoscientists were able to interpret thin beds below ...
Case Study with Petrobras: Applying Unsupervised Multi-Attribute Machine Learning for 3D Stratigraphic Facies Classification in a Carbonate Field, Offshore Brazil
Using machine learning to classify a 100-square-mile seismic volume in the Niobrara, geoscientists were able to interpret thin beds below ...
Applying Machine Learning Technologies in the Niobrara Formation, DJ Basin, to Quickly Produce an Integrated Structural and Stratigraphic Seismic Classification Volume Calibrated to Wells
Carolan Laudon, Jie Qi, Yin-Kai Wang, Geophysical Research, LLC (d/b/a Geophysical Insights), University of Houston | Published with permission: Unconventional Resources ...
Shopping Cart
  • Registration confirmation will be emailed to you.

  • We're committed to your privacy. Geophysical Insights uses the information you provide to us to contact you about our relevant content, events, and products. You may unsubscribe from these communications at any time. For more information, check out our Privacy Policy

    Deborah SacreyOwner - Auburn Energy

    How to Use Paradise to Interpret Carbonate Reservoirs

    The key to understanding Carbonate reservoirs in Paradise start with good synthetic ties to the wavelet data. If one is not tied correctly, then it will be very east to mis-interpret the neurons as reservoir, when they are not. Secondly, the workflow should utilize Principal Component Analysis to better understand the zone of interest and the attributes to use in the SOM analysis. An important part to interpretation is understanding “Halo” and “Trailing” neurons as part of the stack around a reservoir or potential reservoir. Usually, one sees this phenomenon around deep, pressured gas reservoirs, but it can happen in shallow reservoirs as well. Two case studies are presented to emphasize the importance of looking for halo or trailing patterns around good reservoirs. One is a deep Edwards example in south central Texas, and the other a shallow oil reservoir in the Austin Chalk in the San Antonio area. Another way to help enhance carbonate reservoirs is through Spectral Decomposition. A case history is shown in the Smackover in Alabama to highlight and focus on an oolitic shoal reservoir which tunes at a specific frequency in the best wells. Not all carbonate porosity is at the top of the deposition. A case history will be discussed looking for porosity in the center portion of a reef in west Texas. And finally, one of the most difficult interpretation challenges in the carbonate spectrum is correctly mapping the interface between two carbonate layers. A simple technique is shown to help with that dilemma, by using few attributes and a low-topology count to understand regional depositional sequences. This example is from the Delaware Basin in southeastern New Mexico.

    Dr. Carrie LaudonSenior Geophysical Consultant

    Applying Unsupervised Multi-Attribute Machine Learning for 3D Stratigraphic Facies Classification in a Carbonate Field, Offshore Brazil

    We present results of a multi-attribute, machine learning study over a pre-salt carbonate field in the Santos Basin, offshore Brazil. These results test the accuracy and potential of Self-organizing maps (SOM) for stratigraphic facies delineation. The study area has an existing detailed geological facies model containing predominantly reef facies in an elongated structure.

    Carrie LaudonSenior Geophysical Consultant - Geophysical Insights

    Automatic Fault Detection and Applying Machine Learning to Detect Thin Beds

    Rapid advances in Machine Learning (ML) are transforming seismic analysis. Using these new tools, geoscientists can accomplish the following quickly and effectively:

    • Run fault detection analysis in a few hours, not weeks
    • Identify thin beds down to a single seismic sample
    • Generate seismic volumes that capture structural and stratigraphic details

    Join us for a ‘Lunch & Learn’ sessions daily at 11:00 where Dr. Carolan (“Carrie”) Laudon will review the theory and results of applying a combination of machine learning tools to obtain the above results.  A detailed agenda follows.

    Agenda

    Automated Fault Detection using 3D CNN Deep Learning

    • Deep learning fault detection
    • Synthetic models
    • Fault image enhancement
    • Semi-supervised learning for visualization
    • Application results
      • Normal faults
      • Fault/fracture trends in complex reservoirs

    Demo of Paradise Fault Detection Thoughtflow®

    Stratigraphic analysis using machine learning with fault detection

    • Attribute Selection using Principal Component Analysis (PCA)
    • Multi-Attribute Classification using Self-Organizing Maps (SOM)
    • Case studies – stratigraphic analysis and fault detection
      • Fault-karst and fracture examples, China
      • Niobrara – Stratigraphic analysis and thin beds, faults
    Thomas ChaparroSenior Geophysicist - Geophysical Insights

    Paradise: A Day in The Life of the Geoscientist

    Over the last several years, the industry has invested heavily in Machine Learning (ML) for better predictions and automation. Dramatic results have been realized in exploration, field development, and production optimization. However, many of these applications have been single use ‘point’ solutions. There is a growing body of evidence that seismic analysis is best served using a combination of ML tools for a specific objective, referred to as ML Orchestration. This talk demonstrates how the Paradise AI workbench applications are used in an integrated workflow to achieve superior results than traditional interpretation methods or single-purpose ML products. Using examples from combining ML-based Fault Detection and Stratigraphic Analysis, the talk will show how ML orchestration produces value for exploration and field development by the interpreter leveraging ML orchestration.

    Aldrin RondonSenior Geophysical Engineer - Dragon Oil

    Machine Learning Fault Detection: A Case Study

    An innovative Fault Pattern Detection Methodology has been carried out using a combination of Machine Learning Techniques to produce a seismic volume suitable for fault interpretation in a structurally and stratigraphic complex field. Through theory and results, the main objective was to demonstrate that a combination of ML tools can generate superior results in comparison with traditional attribute extraction and data manipulation through conventional algorithms. The ML technologies applied are a supervised, deep learning, fault classification followed by an unsupervised, multi-attribute classification combining fault probability and instantaneous attributes.

    Thomas ChaparroSenior Geophysicist - Geophysical Insights

    Thomas Chaparro is a Senior Geophysicist who specializes in training and preparing AI-based workflows. Thomas also has experience as a processing geophysicist and 2D and 3D seismic data processing. He has participated in projects in the Gulf of Mexico, offshore Africa, the North Sea, Australia, Alaska, and Brazil.

    Thomas holds a bachelor’s degree in Geology from Northern Arizona University and a Master’s in Geophysics from the University of California, San Diego. His research focus was computational geophysics and seismic anisotropy.

    Aldrin RondonSenior Geophysical Engineer - Dragon Oil

    Bachelor’s Degree in Geophysical Engineering from Central University in Venezuela with a specialization in Reservoir Characterization from Simon Bolivar University.

    Over 20 years exploration and development geophysical experience with extensive 2D and 3D seismic interpretation including acquisition and processing.

    Aldrin spent his formative years working on exploration activity in PDVSA Venezuela followed by a period working for a major international consultant company in the Gulf of Mexico (Landmark, Halliburton) as a G&G consultant. Latterly he was working at Helix in Scotland, UK on producing assets in the Central and South North Sea.  From 2007 to 2021, he has been working as a Senior Seismic Interpreter in Dubai involved in different dedicated development projects in the Caspian Sea.

    Deborah SacreyOwner - Auburn Energy

    How to Use Paradise to Interpret Clastic Reservoirs

    The key to understanding Clastic reservoirs in Paradise starts with good synthetic ties to the wavelet data. If one is not tied correctly, then it will be easy to mis-interpret the neurons as reservoir, whin they are not. Secondly, the workflow should utilize Principal Component Analysis to better understand the zone of interest and the attributes to use in the SOM analysis. An important part to interpretation is understanding “Halo” and “Trailing” neurons as part of the stack around a reservoir or potential reservoir. Deep, high-pressured reservoirs often “leak” or have vertical percolation into the seal. This changes the rock properties enough in the seal to create a “halo” effect in SOM. Likewise, the frequency changes of the seismic can cause a subtle “dim-out”, not necessarily observable in the wavelet data, but enough to create a different pattern in the Earth in terms of these rock property changes. Case histories for Halo and trailing neural information include deep, pressured, Chris R reservoir in Southern Louisiana, Frio pay in Southeast Texas and AVO properties in the Yegua of Wharton County. Additional case histories to highlight interpretation include thin-bed pays in Brazoria County, including updated information using CNN fault skeletonization. Continuing the process of interpretation is showing a case history in Wharton County on using Low Probability to help explore Wilcox reservoirs. Lastly, a look at using Paradise to help find sweet spots in unconventional reservoirs like the Eagle Ford, a case study provided by Patricia Santigrossi.

    Mike DunnSr. Vice President of Business Development

    Machine Learning in the Cloud

    Machine Learning in the Cloud will address the capabilities of the Paradise AI Workbench, featuring on-demand access enabled by the flexible hardware and storage facilities available on Amazon Web Services (AWS) and other commercial cloud services. Like the on-premise instance, Paradise On-Demand provides guided workflows to address many geologic challenges and investigations. The presentation will show how geoscientists can accomplish the following workflows quickly and effectively using guided ThoughtFlows® in Paradise:

    • Identify and calibrate detailed stratigraphy using seismic and well logs
    • Classify seismic facies
    • Detect faults automatically
    • Distinguish thin beds below conventional tuning
    • Interpret Direct Hydrocarbon Indicators
    • Estimate reserves/resources

    Attend the talk to see how ML applications are combined through a process called "Machine Learning Orchestration," proven to extract more from seismic and well data than traditional means.

    Sarah Stanley
    Senior Geoscientist

    Stratton Field Case Study – New Solutions to Old Problems

    The Oligocene Frio gas-producing Stratton Field in south Texas is a well-known field. Like many onshore fields, the productive sand channels are difficult to identify using conventional seismic data. However, the productive channels can be easily defined by employing several Paradise modules, including unsupervised machine learning, Principal Component Analysis, Self-Organizing Maps, 3D visualization, and the new Well Log Cross Section and Well Log Crossplot tools. The Well Log Cross Section tool generates extracted seismic data, including SOMs, along the Cross Section boreholes and logs. This extraction process enables the interpreter to accurately identify the SOM neurons associated with pay versus neurons associated with non-pay intervals. The reservoir neurons can be visualized throughout the field in the Paradise 3D Viewer, with Geobodies generated from the neurons. With this ThoughtFlow®, pay intervals previously difficult to see in conventional seismic can finally be visualized and tied back to the well data.

    Laura Cuttill
    Practice Lead, Advertas

    Young Professionals – Managing Your Personal Brand to Level-up Your Career

    No matter where you are in your career, your online “personal brand” has a huge impact on providing opportunity for prospective jobs and garnering the respect and visibility needed for advancement. While geoscientists tackle ambitious projects, publish in technical papers, and work hard to advance their careers, often, the value of these isn’t realized beyond their immediate professional circle. Learn how to…

    • - Communicate who you are to high-level executives in exploration and development
    • - Avoid common social media pitfalls
    • - Optimize your online presence to best garner attention from recruiters
    • - Stay relevant
    • - Create content of interest
    • - Establish yourself as a thought leader in your given area of specialization
    Laura Cuttill
    Practice Lead, Advertas

    As a 20-year marketing veteran marketing in oil and gas and serial entrepreneur, Laura has deep experience in bringing technology products to market and growing sales pipeline. Armed with a marketing degree from Texas A&M, she began her career doing technical writing for Schlumberger and ExxonMobil in 2001. She started Advertas as a co-founder in 2004 and began to leverage her upstream experience in marketing. In 2006, she co-founded the cyber-security software company, 2FA Technology. After growing 2FA from a startup to 75% market share in target industries, and the subsequent sale of the company, she returned to Advertas to continue working toward the success of her clients, such as Geophysical Insights. Today, she guides strategy for large-scale marketing programs, manages project execution, cultivates relationships with industry media, and advocates for data-driven, account-based marketing practices.

    Fabian Rada
    Sr. Geophysicist, Petroleum Oil & Gas Services

    Statistical Calibration of SOM results with Well Log Data (Case Study)

    The first stage of the proposed statistical method has proven to be very useful in testing whether or not there is a relationship between two qualitative variables (nominal or ordinal) or categorical quantitative variables, in the fields of health and social sciences. Its application in the oil industry allows geoscientists not only to test dependence between discrete variables, but to measure their degree of correlation (weak, moderate or strong). This article shows its application to reveal the relationship between a SOM classification volume of a set of nine seismic attributes (whose vertical sampling interval is three meters) and different well data (sedimentary facies, Net Reservoir, and effective porosity grouped by ranges). The data were prepared to construct the contingency tables, where the dependent (response) variable and independent (explanatory) variable were defined, the observed frequencies were obtained, and the frequencies that would be expected if the variables were independent were calculated and then the difference between the two magnitudes was studied using the contrast statistic called Chi-Square. The second stage implies the calibration of the SOM volume extracted along the wellbore path through statistical analysis of the petrophysical properties VCL and PHIE, and SW for each neuron, which allowed to identify the neurons with the best petrophysical values in a carbonate reservoir.

    Heather Bedle
    Assistant Professor, University of Oklahoma

    Heather Bedle received a B.S. (1999) in physics from Wake Forest University, and then worked as a systems engineer in the defense industry. She later received a M.S. (2005) and a Ph. D. (2008) degree from Northwestern University. After graduate school, she joined Chevron and worked as both a development geologist and geophysicist in the Gulf of Mexico before joining Chevron’s Energy Technology Company Unit in Houston, TX. In this position, she worked with the Rock Physics from Seismic team analyzing global assets in Chevron’s portfolio. Dr. Bedle is currently an assistant professor of applied geophysics at the University of Oklahoma’s School of Geosciences. She joined OU in 2018, after instructing at the University of Houston for two years. Dr. Bedle and her student research team at OU primarily work with seismic reflection data, using advanced techniques such as machine learning, attribute analysis, and rock physics to reveal additional structural, stratigraphic and tectonic insights of the subsurface.

    Jie Qi
    Research Geophysicist

    An Integrated Fault Detection Workflow

    Seismic fault detection is one of the top critical procedures in seismic interpretation. Identifying faults are significant for characterizing and finding the potential oil and gas reservoirs. Seismic amplitude data exhibiting good resolution and a high signal-to-noise ratio are key to identifying structural discontinuities using seismic attributes or machine learning techniques, which in turn serve as input for automatic fault extraction. Deep learning Convolutional Neural Networks (CNN) performs well on fault detection without any human-computer interactive work. This study shows an integrated CNN-based fault detection workflow to construct fault images that are sufficiently smooth for subsequent fault automatic extraction. The objectives were to suppress noise or stratigraphic anomalies subparallel to reflector dip, and sharpen fault and other discontinuities that cut reflectors, preconditioning the fault images for subsequent automatic extraction. A 2D continuous wavelet transform-based acquisition footprint suppression method was applied time slice by time slice to suppress wavenumber components to avoid interpreting the acquisition footprint as artifacts by the CNN fault detection method. To further suppress cross-cutting noise as well as sharpen fault edges, a principal component edge-preserving structure-oriented filter is also applied. The conditioned amplitude volume is then fed to a pre-trained CNN model to compute fault probability. Finally, a Laplacian of Gaussian filter is applied to the original CNN fault probability to enhance fault images. The resulting fault probability volume is favorable with respect to traditional human-interpreter generated on vertical slices through the seismic amplitude volume.

    Dr. Jie Qi
    Research Geophysicist

    An integrated machine learning-based fault classification workflow

    We introduce an integrated machine learning-based fault classification workflow that creates fault component classification volumes that greatly reduces the burden on the human interpreter. We first compute a 3D fault probability volume from pre-conditioned seismic amplitude data using a 3D convolutional neural network (CNN). However, the resulting “fault probability” volume delineates other non-fault edges such as angular unconformities, the base of mass transport complexes, and noise such as acquisition footprint. We find that image processing-based fault discontinuity enhancement and skeletonization methods can enhance the fault discontinuities and suppress many of the non-fault discontinuities. Although each fault is characterized by its dip and azimuth, these two properties are discontinuous at azimuths of φ=±180° and for near vertical faults for azimuths φ and φ+180° requiring them to be parameterized as four continuous geodetic fault components. These four fault components as well as the fault probability can then be fed into a self-organizing map (SOM) to generate fault component classification. We find that the final classification result can segment fault sets trending in interpreter-defined orientations and minimize the impact of stratigraphy and noise by selecting different neurons from the SOM 2D neuron color map.

    Ivan Marroquin
    Senior Research Geophysicist

    Connecting Multi-attribute Classification to Reservoir Properties

    Interpreters rely on seismic pattern changes to identify and map geologic features of importance. The ability to recognize such features depends on the seismic resolution and characteristics of seismic waveforms. With the advancement of machine learning algorithms, new methods for interpreting seismic data are being developed. Among these algorithms, self-organizing maps (SOM) provides a different approach to extract geological information from a set of seismic attributes.

    SOM approximates the input patterns by a finite set of processing neurons arranged in a regular 2D grid of map nodes. Such that, it classifies multi-attribute seismic samples into natural clusters following an unsupervised approach. Since machine learning is unbiased, so the classifications can contain both geological information and coherent noise. Thus, seismic interpretation evolves into broader geologic perspectives. Additionally, SOM partitions multi-attribute samples without a priori information to guide the process (e.g., well data).

    The SOM output is a new seismic attribute volume, in which geologic information is captured from the classification into winning neurons. Implicit and useful geological information are uncovered through an interactive visual inspection of winning neuron classifications. By doing so, interpreters build a classification model that aids them to gain insight into complex relationships between attribute patterns and geological features.

    Despite all these benefits, there are interpretation challenges regarding whether there is an association between winning neurons and geological features. To address these issues, a bivariate statistical approach is proposed. To evaluate this analysis, three cases scenarios are presented. In each case, the association between winning neurons and net reservoir (determined from petrophysical or well log properties) at well locations is analyzed. The results show that the statistical analysis not only aid in the identification of classification patterns; but more importantly, reservoir/not reservoir classification by classical petrophysical analysis strongly correlates with selected SOM winning neurons. Confidence in interpreted classification features is gained at the borehole and interpretation is readily extended as geobodies away from the well.

    Heather Bedle
    Assistant Professor, University of Oklahoma

    Gas Hydrates, Reefs, Channel Architecture, and Fizz Gas: SOM Applications in a Variety of Geologic Settings

    Students at the University of Oklahoma have been exploring the uses of SOM techniques for the last year. This presentation will review learnings and results from a few of these research projects. Two projects have investigated the ability of SOMs to aid in identification of pore space materials – both trying to qualitatively identify gas hydrates and under-saturated gas reservoirs. A third study investigated individual attributes and SOMs in recognizing various carbonate facies in a pinnacle reef in the Michigan Basin. The fourth study took a deep dive of various machine learning algorithms, of which SOMs will be discussed, to understand how much machine learning can aid in the identification of deepwater channel architectures.

    Fabian Rada
    Sr. Geophysicist, Petroleum Oil & Gas Servicest

    Fabian Rada joined Petroleum Oil and Gas Services, Inc (POGS) in January 2015 as Business Development Manager and Consultant to PEMEX. In Mexico, he has participated in several integrated oil and gas reservoir studies. He has consulted with PEMEX Activos and the G&G Technology group to apply the Paradise AI workbench and other tools. Since January 2015, he has been working with Geophysical Insights staff to provide and implement the multi-attribute analysis software Paradise in Petróleos Mexicanos (PEMEX), running a successful pilot test in Litoral Tabasco Tsimin Xux Asset. Mr. Rada began his career in the Venezuelan National Foundation for Seismological Research, where he participated in several geophysical projects, including seismic and gravity data for micro zonation surveys. He then joined China National Petroleum Corporation (CNPC) as QC Geophysicist until he became the Chief Geophysicist in the QA/QC Department. Then, he transitioned to a subsidiary of Petróleos de Venezuela (PDVSA), as a member of the QA/QC and Chief of Potential Field Methods section. Mr. Rada has also participated in processing land seismic data and marine seismic/gravity acquisition surveys. Mr. Rada earned a B.S. in Geophysics from the Central University of Venezuela.

    Hal GreenDirector, Marketing & Business Development - Geophysical Insights

    Introduction to Automatic Fault Detection and Applying Machine Learning to Detect Thin Beds

    Rapid advances in Machine Learning (ML) are transforming seismic analysis. Using these new tools, geoscientists can accomplish the following quickly and effectively: a combination of machine learning (ML) and deep learning applications, geoscientists apply Paradise to extract greater insights from seismic and well data for these and other objectives:

    • Run fault detection analysis in a few hours, not weeks
    • Identify thin beds down to a single seismic sample
    • Overlay fault images on stratigraphic analysis

    The brief introduction will orient you with the technology and examples of how machine learning is being applied to automate interpretation while generating new insights in the data.

    Sarah Stanley
    Senior Geoscientist and Lead Trainer

    Sarah Stanley joined Geophysical Insights in October, 2017 as a geoscience consultant, and became a full-time employee July 2018. Prior to Geophysical Insights, Sarah was employed by IHS Markit in various leadership positions from 2011 to her retirement in August 2017, including Director US Operations Training and Certification, the Operational Governance Team, and, prior to February 2013, Director of IHS Kingdom Training. Sarah joined SMT in May, 2002, and was the Director of Training for SMT until IHS Markit’s acquisition in 2011.

    Prior to joining SMT Sarah was employed by GeoQuest, a subdivision of Schlumberger, from 1998 to 2002. Sarah was also Director of the Geoscience Technology Training Center, North Harris College from 1995 to 1998, and served as a voluntary advisor on geoscience training centers to various geological societies. Sarah has over 37 years of industry experience and has worked as a petroleum geoscientist in various domestic and international plays since August of 1981. Her interpretation experience includes tight gas sands, coalbed methane, international exploration, and unconventional resources.

    Sarah holds a Bachelor’s of Science degree with majors in Biology and General Science and minor in Earth Science, a Master’s of Arts in Education and Master’s of Science in Geology from Ball State University, Muncie, Indiana. Sarah is both a Certified Petroleum Geologist, and a Registered Geologist with the State of Texas. Sarah holds teaching credentials in both Indiana and Texas.

    Sarah is a member of the Houston Geological Society and the American Association of Petroleum Geologists, where she currently serves in the AAPG House of Delegates. Sarah is a recipient of the AAPG Special Award, the AAPG House of Delegates Long Service Award, and the HGS President’s award for her work in advancing training for petroleum geoscientists. She has served on the AAPG Continuing Education Committee and was Chairman of the AAPG Technical Training Center Committee. Sarah has also served as Secretary of the HGS, and Served two years as Editor for the AAPG Division of Professional Affairs Correlator.

    Dr. Tom Smith
    President & CEO

    Dr. Tom Smith received a BS and MS degree in Geology from Iowa State University. His graduate research focused on a shallow refraction investigation of the Manson astrobleme. In 1971, he joined Chevron Geophysical as a processing geophysicist but resigned in 1980 to complete his doctoral studies in 3D modeling and migration at the Seismic Acoustics Lab at the University of Houston. Upon graduation with the Ph.D. in Geophysics in 1981, he started a geophysical consulting practice and taught seminars in seismic interpretation, seismic acquisition and seismic processing. Dr. Smith founded Seismic Micro-Technology in 1984 to develop PC software to support training workshops which subsequently led to development of the KINGDOM Software Suite for integrated geoscience interpretation with world-wide success.

    The Society of Exploration Geologists (SEG) recognized Dr. Smith’s work with the SEG Enterprise Award in 2000, and in 2010, the Geophysical Society of Houston (GSH) awarded him an Honorary Membership. Iowa State University (ISU) has recognized Dr. Smith throughout his career with the Distinguished Alumnus Lecturer Award in 1996, the Citation of Merit for National and International Recognition in 2002, and the highest alumni honor in 2015, the Distinguished Alumni Award. The University of Houston College of Natural Sciences and Mathematics recognized Dr. Smith with the 2017 Distinguished Alumni Award.

    In 2009, Dr. Smith founded Geophysical Insights, where he leads a team of geophysicists, geologists and computer scientists in developing advanced technologies for fundamental geophysical problems. The company launched the Paradise® multi-attribute analysis software in 2013, which uses Machine Learning and pattern recognition to extract greater information from seismic data.

    Dr. Smith has been a member of the SEG since 1967 and is a professional member of SEG, GSH, HGS, EAGE, SIPES, AAPG, Sigma XI, SSA and AGU. Dr. Smith served as Chairman of the SEG Foundation from 2010 to 2013. On January 25, 2016, he was recognized by the Houston Geological Society (HGS) as a geophysicist who has made significant contributions to the field of geology. He currently serves on the SEG President-Elect’s Strategy and Planning Committee and the ISU Foundation Campaign Committee for Forever True, For Iowa State.

    Carrie LaudonSenior Geophysical Consultant - Geophysical Insights

    Applying Machine Learning Technologies in the Niobrara Formation, DJ Basin, to Quickly Produce an Integrated Structural and Stratigraphic Seismic Classification Volume Calibrated to Wells

    This study will demonstrate an automated machine learning approach for fault detection in a 3D seismic volume. The result combines Deep Learning Convolution Neural Networks (CNN) with a conventional data pre-processing step and an image processing-based post processing approach to produce high quality fault attribute volumes of fault probability, fault dip magnitude and fault dip azimuth. These volumes are then combined with instantaneous attributes in an unsupervised machine learning classification, allowing the isolation of both structural and stratigraphic features into a single 3D volume. The workflow is illustrated on a 3D seismic volume from the Denver Julesburg Basin and a statistical analysis is used to calibrate results to well data.

    Ivan Marroquin
    Senior Research Geophysicist

    Iván Dimitri Marroquín is a 20-year veteran of data science research, consistently publishing in peer-reviewed journals and speaking at international conference meetings. Dr. Marroquín received a Ph.D. in geophysics from McGill University, where he conducted and participated in 3D seismic research projects. These projects focused on the development of interpretation techniques based on seismic attributes and seismic trace shape information to identify significant geological features or reservoir physical properties. Examples of his research work are attribute-based modeling to predict coalbed thickness and permeability zones, combining spectral analysis with coherency imagery technique to enhance interpretation of subtle geologic features, and implementing a visual-based data mining technique on clustering to match seismic trace shape variability to changes in reservoir properties.

    Dr. Marroquín has also conducted some ground-breaking research on seismic facies classification and volume visualization. This lead to his development of a visual-based framework that determines the optimal number of seismic facies to best reveal meaningful geologic trends in the seismic data. He proposed seismic facies classification as an alternative to data integration analysis to capture geologic information in the form of seismic facies groups. He has investigated the usefulness of mobile devices to locate, isolate, and understand the spatial relationships of important geologic features in a context-rich 3D environment. In this work, he demonstrated mobile devices are capable of performing seismic volume visualization, facilitating the interpretation of imaged geologic features.  He has definitively shown that mobile devices eventually will allow the visual examination of seismic data anywhere and at any time.

    In 2016, Dr. Marroquín joined Geophysical Insights as a senior researcher, where his efforts have been focused on developing machine learning solutions for the oil and gas industry. For his first project, he developed a novel procedure for lithofacies classification that combines a neural network with automated machine methods. In parallel, he implemented a machine learning pipeline to derive cluster centers from a trained neural network. The next step in the project is to correlate lithofacies classification to the outcome of seismic facies analysis.  Other research interests include the application of diverse machine learning technologies for analyzing and discerning trends and patterns in data related to oil and gas industry.

    Dr. Jie Qi
    Research Geophysicist

    Dr. Jie Qi is a Research Geophysicist at Geophysical Insights, where he works closely with product development and geoscience consultants. His research interests include machine learning-based fault detection, seismic interpretation, pattern recognition, image processing, seismic attribute development and interpretation, and seismic facies analysis. Dr. Qi received a BS (2011) in Geoscience from the China University of Petroleum in Beijing, and an MS (2013) in Geophysics from the University of Houston. He earned a Ph.D. (2017) in Geophysics from the University of Oklahoma, Norman. His industry experience includes work as a Research Assistant (2011-2013) at the University of Houston and the University of Oklahoma (2013-2017). Dr. Qi was with Petroleum Geo-Services (PGS), Inc. in 2014 as a summer intern, where he worked on a semi-supervised seismic facies analysis. In 2017, he served as a postdoctoral Research Associate in the Attributed Assisted-Seismic Processing and Interpretation (AASPI) consortium at the University of Oklahoma from 2017 to 2020.

    Rocky R. Roden
    Senior Consulting Geophysicist

    The Relationship of Self-Organization, Geology, and Machine Learning

    Self-organization is the nonlinear formation of spatial and temporal structures, patterns or functions in complex systems (Aschwanden et al., 2018). Simple examples of self-organization include flocks of birds, schools of fish, crystal development, formation of snowflakes, and fractals. What these examples have in common is the appearance of structure or patterns without centralized control. Self-organizing systems are typically governed by power laws, such as the Gutenberg-Richter law of earthquake frequency and magnitude. In addition, the time frames of such systems display a characteristic self-similar (fractal) response, where earthquakes or avalanches for example, occur over all possible time scales (Baas, 2002).

    The existence of nonlinear dynamic systems and ordered structures in the earth are well known and have been studied for centuries and can appear as sedimentary features, layered and folded structures, stratigraphic formations, diapirs, eolian dune systems, channelized fluvial and deltaic systems, and many more (Budd, et al., 2014; Dietrich and Jacob, 2018). Each of these geologic processes and features exhibit patterns through the action of undirected local dynamics and is generally termed “self-organization” (Paola, 2014).

    Artificial intelligence and specifically neural networks exhibit and reveal self-organization characteristics. The reason for the interest in applying neural networks stems from the fact that they are universal approximators for various kinds of nonlinear dynamical systems of arbitrary complexity (Pessa, 2008). A special class of artificial neural networks is aptly named self-organizing map (SOM) (Kohonen, 1982). It has been found that SOM can identify significant organizational structure in the form of clusters from seismic attributes that relate to geologic features (Strecker and Uden, 2002; Coleou et al., 2003; de Matos, 2006; Roy et al., 2013; Roden et al., 2015; Zhao et al., 2016; Roden et al., 2017; Zhao et al., 2017; Roden and Chen, 2017; Sacrey and Roden, 2018; Leal et al, 2019; Hussein et al., 2020; Hardage et al., 2020; Manauchehri et al., 2020). As a consequence, SOM is an excellent machine learning neural network approach utilizing seismic attributes to help identify self-organization features and define natural geologic patterns not easily seen or seen at all in the data.

    Rocky R. Roden
    Senior Consulting Geophysicist

    Rocky R. Roden started his own consulting company, Rocky Ridge Resources Inc. in 2003 and works with several oil companies on technical and prospect evaluation issues. He is also a principal in the Rose and Associates DHI Risk Analysis Consortium and was Chief Consulting Geophysicist with Seismic Micro-technology. Rocky is a proven oil finder with 37 years in the industry, gaining extensive knowledge of modern geoscience technical approaches.

    Rocky holds a BS in Oceanographic Technology-Geology from Lamar University and a MS in Geological and Geophysical Oceanography from Texas A&M University. As Chief Geophysicist and Director of Applied Technology for Repsol-YPF, his role comprised of advising corporate officers, geoscientists, and managers on interpretation, strategy and technical analysis for exploration and development in offices in the U.S., Argentina, Spain, Egypt, Bolivia, Ecuador, Peru, Brazil, Venezuela, Malaysia, and Indonesia. He has been involved in the technical and economic evaluation of Gulf of Mexico lease sales, farmouts worldwide, and bid rounds in South America, Europe, and the Far East. Previous work experience includes exploration and development at Maxus Energy, Pogo Producing, Decca Survey, and Texaco. Rocky is a member of SEG, AAPG, HGS, GSH, EAGE, and SIPES; he is also a past Chairman of The Leading Edge Editorial Board.

    Bob A. Hardage

    Bob A. Hardage received a PhD in physics from Oklahoma State University. His thesis work focused on high-velocity micro-meteoroid impact on space vehicles, which required trips to Goddard Space Flight Center to do finite-difference modeling on dedicated computers. Upon completing his university studies, he worked at Phillips Petroleum Company for 23 years and was Exploration Manager for Asia and Latin America when he left Phillips. He moved to WesternAtlas and worked 3 years as Vice President of Geophysical Development and Marketing. He then established a multicomponent seismic research laboratory at the Bureau of Economic Geology and served The University of Texas at Austin as a Senior Research Scientist for 28 years. He has published books on VSP, cross-well profiling, seismic stratigraphy, and multicomponent seismic technology. He was the first person to serve 6 years on the Board of Directors of the Society of Exploration Geophysicists (SEG). His Board service was as SEG Editor (2 years), followed by 1-year terms as First VP, President Elect, President, and Past President. SEG has awarded him a Special Commendation, Life Membership, and Honorary Membership. He wrote the AAPG Explorer column on geophysics for 6 years. AAPG honored him with a Distinguished Service award for promoting geophysics among the geological community.

    Bob A. Hardage

    Investigating the Internal Fabric of VSP data with Attribute Analysis and Unsupervised Machine Learning

    Examination of vertical seismic profile (VSP) data with unsupervised machine learning technology is a rigorous way to compare the fabric of down-going, illuminating, P and S wavefields with the fabric of up-going reflections and interbed multiples created by these wavefields. This concept is introduced in this paper by applying unsupervised learning to VSP data to better understand the physics of P and S reflection seismology. The zero-offset VSP data used in this investigation were acquired in a hard-rock, fast-velocity, environment that caused the shallowest 2 or 3 geophones to be inside the near-field radiation zone of a vertical-vibrator baseplate. This study shows how to use instantaneous attributes to backtrack down-going direct-P and direct-S illuminating wavelets to the vibrator baseplate inside the near-field zone. This backtracking confirms that the points-of-origin of direct-P and direct-S are identical. The investigation then applies principal component (PCA) analysis to VSP data and shows that direct-S and direct-P wavefields that are created simultaneously at a vertical-vibrator baseplate have the same dominant principal components. A self-organizing map (SOM) approach is then taken to illustrate how unsupervised machine learning describes the fabric of down-going and up-going events embedded in vertical-geophone VSP data. These SOM results show that a small number of specific neurons build the down-going direct-P illuminating wavefield, and another small group of neurons build up-going P primary reflections and early-arriving down-going P multiples. The internal attribute fabric of these key down-going and up-going neurons are then compared to expose their similarities and differences. This initial study indicates that unsupervised machine learning, when applied to VSP data, is a powerful tool for understanding the physics of seismic reflectivity at a prospect. This research strategy of analyzing VSP data with unsupervised machine learning will now expand to horizontal-geophone VSP data.

    Tom Smith
    President and CEO, Geophysical Insights

    Machine Learning for Incomplete Geoscientists

    This presentation covers big-picture machine learning buzz words with humor and unassailable frankness. The goal of the material is for every geoscientist to gain confidence in these important concepts and how they add to our well-established practices, particularly seismic interpretation. Presentation topics include a machine learning historical perspective, what makes it different, a fish factory, Shazam, comparison of supervised and unsupervised machine learning methods with examples, tuning thickness, deep learning, hard/soft attribute spaces, multi-attribute samples, and several interpretation examples. After the presentation, you may not know how to run machine learning algorithms, but you should be able to appreciate their value and avoid some of their limitations.

    Deborah Sacrey
    Owner, Auburn Energy

    Deborah is a geologist/geophysicist with 44 years of oil and gas exploration experience in Texas, Louisiana Gulf Coast and Mid-Continent areas of the US. She received her degree in Geology from the University of Oklahoma in 1976 and immediately started working for Gulf Oil in their Oklahoma City offices.

    She started her own company, Auburn Energy, in 1990 and built her first geophysical workstation using Kingdom software in 1996. She helped SMT/IHS for 18 years in developing and testing the Kingdom Software. She specializes in 2D and 3D interpretation for clients in the US and internationally. For the past nine years she has been part of a team to study and bring the power of multi-attribute neural analysis of seismic data to the geoscience public, guided by Dr. Tom Smith, founder of SMT. She has become an expert in the use of Paradise software and has seven discoveries for clients using multi-attribute neural analysis.

    Deborah has been very active in the geological community. She is past national President of SIPES (Society of Independent Professional Earth Scientists), past President of the Division of Professional Affairs of AAPG (American Association of Petroleum Geologists), Past Treasurer of AAPG and Past President of the Houston Geological Society. She is also Past President of the Gulf Coast Association of Geological Societies and just ended a term as one of the GCAGS representatives on the AAPG Advisory Council. Deborah is also a DPA Certified Petroleum Geologist #4014 and DPA Certified Petroleum Geophysicist #2. She belongs to AAPG, SIPES, Houston Geological Society, South Texas Geological Society and the Oklahoma City Geological Society (OCGS).

    Mike Dunn
    Senior Vice President Business Development

    Michael A. Dunn is an exploration executive with extensive global experience including the Gulf of Mexico, Central America, Australia, China and North Africa. Mr. Dunn has a proven a track record of successfully executing exploration strategies built on a foundation of new and innovative technologies. Currently, Michael serves as Senior Vice President of Business Development for Geophysical Insights.

    He joined Shell in 1979 as an exploration geophysicist and party chief and held increasing levels or responsibility including Manager of Interpretation Research. In 1997, he participated in the launch of Geokinetics, which completed an IPO on the AMEX in 2007. His extensive experience with oil companies (Shell and Woodside) and the service sector (Geokinetics and Halliburton) has provided him with a unique perspective on technology and applications in oil and gas. Michael received a B.S. in Geology from Rutgers University and an M.S. in Geophysics from the University of Chicago.

    Hal GreenDirector, Marketing & Business Development - Geophysical Insights

    Hal H. Green is a marketing executive and entrepreneur in the energy industry with more than 25 years of experience in starting and managing technology companies. He holds a B.S. in Electrical Engineering from Texas A&M University and an MBA from the University of Houston. He has invested his career at the intersection of marketing and technology, with a focus on business strategy, marketing, and effective selling practices. Mr. Green has a diverse portfolio of experience in marketing technology to the hydrocarbon supply chain – from upstream exploration through downstream refining & petrochemical. Throughout his career, Mr. Green has been a proven thought-leader and entrepreneur, while supporting several tech start-ups.

    He started his career as a process engineer in the semiconductor manufacturing industry in Dallas, Texas and later launched an engineering consulting and systems integration business. Following the sale of that business in the late 80’s, he joined Setpoint in Houston, Texas where he eventually led that company’s Manufacturing Systems business. Aspen Technology acquired Setpoint in January 1996 and Mr. Green continued as Director of Business Development for the Information Management and Polymer Business Units.

    In 2004, Mr. Green founded Advertas, a full-service marketing and public relations firm serving clients in energy and technology. In 2010, Geophysical Insights retained Advertas as their marketing firm. Dr. Tom Smith, President/CEO of Geophysical Insights, soon appointed Mr. Green as Director of Marketing and Business Development for Geophysical Insights, in which capacity he still serves today.

    Hana Kabazi
    Product Manager

    Hana Kabazi joined Geophysical Insights in October of 201, and is now one of our Product Managers for Paradise. Mrs. Kabazi has over 7 years of oil and gas experience, including 5 years and Halliburton – Landmark. During her time at Landmark she held positions as a consultant to many E&P companies, technical advisor to the QA organization, and as product manager of Subsurface Mapping in DecsionSpace. Mrs. Kabazi has a B.S. in Geology from the University of Texas Austin, and an M.S. in Geology from the University of Houston.

    Dr. Carrie LaudonSenior Geophysical Consultant - Geophysical Insights

    Carolan (Carrie) Laudon holds a PhD in geophysics from the University of Minnesota and a BS in geology from the University of Wisconsin Eau Claire. She has been Senior Geophysical Consultant with Geophysical Insights since 2017 working with Paradise®, their machine learning platform. Prior roles include Vice President of Consulting Services and Microseismic Technology for Global Geophysical Services and 17 years with Schlumberger in technical, management and sales, starting in Alaska and including Aberdeen, Scotland, Houston, TX, Denver, CO and Reading, England. She spent five years early in her career with ARCO Alaska as a seismic interpreter for the Central North Slope exploration team.