A Workflow to Skeletonize Faults and Stratigraphic Features

By Jie Qi, Gabriel Machado, and Kurt Marfurt | Published with permission: Geophysics Vol. 82, No. 4 | July 2017

Abstract

Improving the accuracy and completeness of subtle discontinuities in noisy seismic data is useful for mapping faults, fractures, unconformities, and stratigraphic edges. We have developed a workflow to improve the quality of coherence attributes. First, we apply principal component structure-oriented filtering to reject random noise and sharpen the lateral edges of seismic amplitude data. Next, we compute eigenstructure coherence, which highlights the stratigraphic and structural discontinuities. We apply a Laplacian of a Gaussian filter to the coherence attribute that sharpens the steeply dipping faults, attenuates the stratigraphic features parallel to the seismic reflectors, and skeletonizes the unconformity features subparallel to the reflectors. Finally, we skeletonize the filtered coherence attribute along with the fault plane. The filtered and skeletonized seismic coherence attribute highlights the geologic discontinuities more clearly and precisely. These discontinuous features can be color coded by their dipping orientation or as a suite of independent, azimuthally limited volumes, providing the interpreter a means of isolating fault sets that are either problematic or especially productive. We validate the effectiveness of our workflow by applying it to seismic surveys acquired from the Gulf of Mexico, USA, and the Great South Basin, New Zealand. The skeletonized result rejects noise and enhances discontinuities seen in the vertical and lateral directions. The corendering of the “fault” azimuth and the fault-dip magnitude exhibits the strengths of the discontinuities and their orientation. Finally, we compared our workflow with the results generated from the swarm intelligence and found our method to be better at tracking short faults and stratigraphic discontinuities.

Introduction

Identification and mapping faults is one of the most important steps in seismic data interpretation in conventional plays, whereas fault identification is critical for identifying potential drilling hazards and characterizing natural fractures in unconventional resource plays. Although major faults seen in a seismic amplitude volume can be easily identified and picked by experienced interpreters, the process is still time consuming, particularly in picking more subtle faults masked by noise. A huge effort has been made to accelerate the procedure of seismic interpretation. In this paper, we introduce a 3D workflow that minimizes coherence artifacts, links disconnected faults and stratigraphic edges, and skeletonizes the results.

Coherence (Marfurt et al., 1998; Gersztenkorn and Marfurt, 1999) is routinely used to detect structural discontinuities in 3D seismic data. Other edge-detection algorithms (e.g., Luo et al.,1996; Dorn et al., 2012; Wang et al., 2016) provide similar results. Unfortunately, coherence measures all lateral discontinuities, including where steeply dipping coherent noise interferes with more gently dipping reflectors. Coherence also delineates channel edges, carbonate buildups, slumps, collapse features, and angular unconformities. In addition, coherence can also be used to detect chaotic textures in multiattribute seismic facies analysis (Qi et al., 2016). Automatic fault extraction in most commercial software packages requires that the seismic attribute is first smoothed prior to skeletonization. Seismic data conditioning for fault interpretation includes removing incoherent noise, sharpening the edges between the hanging wall and footwall, and flattening the spectrum of the seismic data. Fehmers and Höcher (2003) propose an edge-preserving structure-oriented filtering (SOF) workflow that uses anisotropic diffusion to reject crosscutting noise in 3D seismic data. Marfurt (2006) generalizes an algorithm developed by Luo (2002), based on overlapping Kuwahara windows. Davogustto and Marfurt (2011) combine these two approaches into one algorithm and cascade them with kx-ky footprint suppression. Zhang et al. (2015) apply the SOF workflow to prestack time-migrated data that improves prestack seismic inversion results. Spectral balancing also improves the coherence image and partially diminished the stair-step artifacts commonly seen on the vertical slices. All these processes are applied to the seismic amplitude data and can be thought to be seismic data processing.

However, one can also filter the coherence image, which we call “image processing.” One of the more popular algorithms is based on swarm intelligence (Randen et al., 2001; Pedersen et al., 2002). Some automated fault-extraction algorithms need human supervision to select appropriate pilot samples or traces. Other innovations include an edge-detection algorithm described by Zhang et al. (2014) that generates skeletonized fault sticks on time slices. The local fault-extraction method can result in a suite of one- pixel-thick labeled fault surfaces from seismic data (Cohen et al., 2006). Wu and Hale (2015) describe a method that maps intersecting faults based on Hale (2013)’s fault-construction technique. AlBinHassan and Marfurt (2003) and Boe (2012) apply Radon transforms to improve fault images, whereas Kadlec et al. (2008) use level sets to address the same objective. Barnes (2006) constructs a second moment tensor of coherence values falling with an analysis window about each voxel to determine the fault orientation, rejecting anomalies parallel to stratigraphy. He then dilates the images to connect disjointed fault segments, followed by skeletonization to reduce their thickness.
Other 3D attribute-based visualization techniques (Wallet et al., 2011; Qi et al., 2014; Marfurt, 2015; Wu and Hale, 2016) are also useful for fault and discontinuity interpretation. Faults illuminated by different geometric attributes can be corendered using red, green, and blue (RGB) or cyan, magenta, and yelow (CMY) to corender multiple coherence volumes computed from spectral components (Henderson et al., 2008; Li and Lu, 2014). Dewett and Henza (2016) extend this approach beyond these coherence images using self-organizing maps to combine the results. These combined fault images were subsequently enhanced using swarm intelligence.

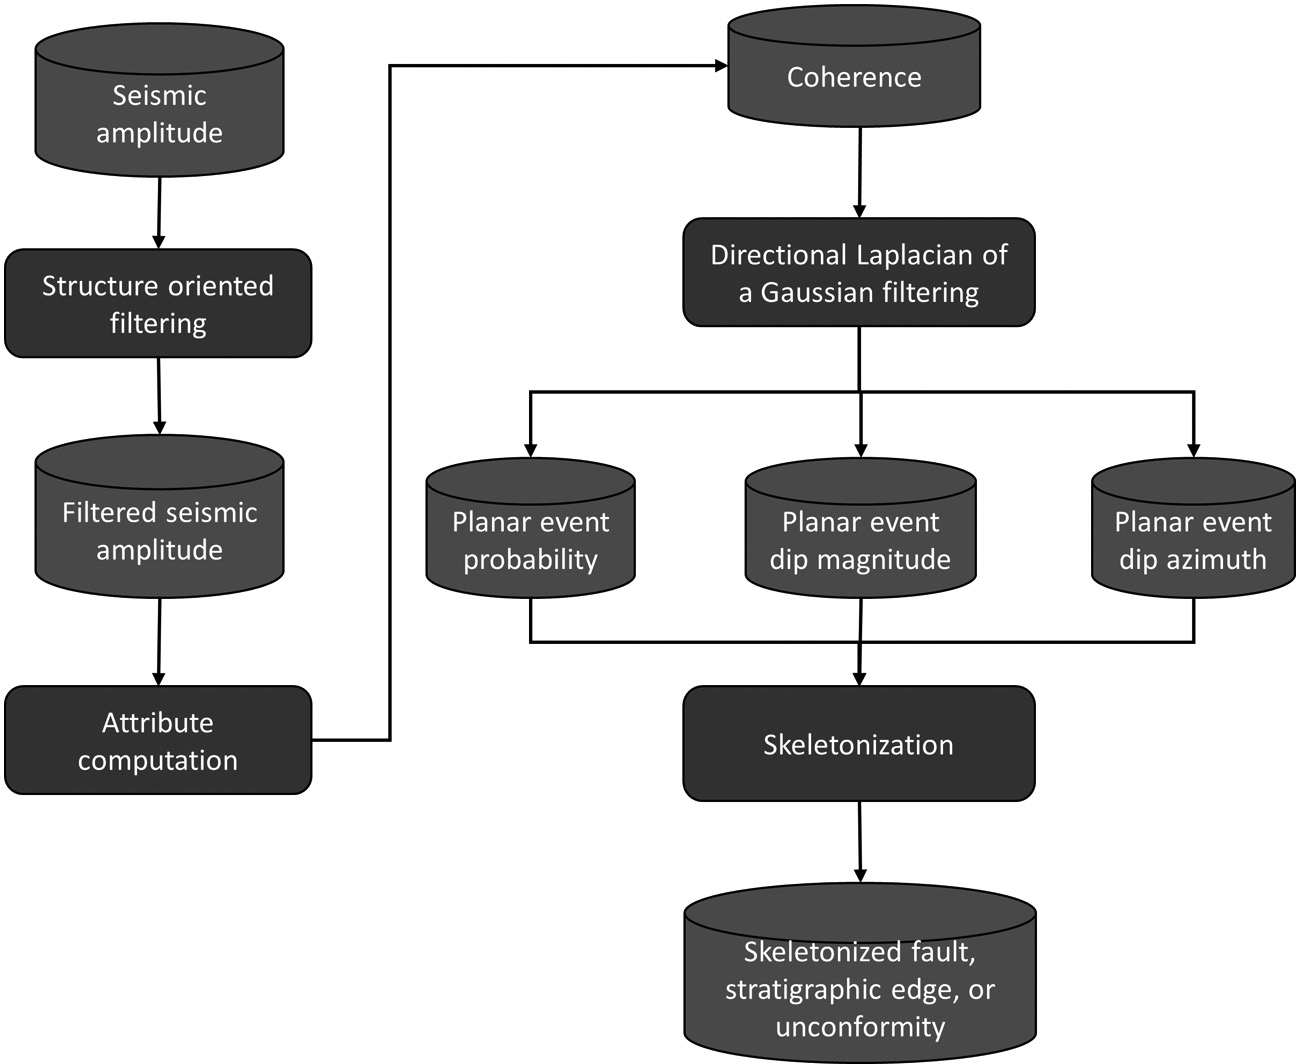
In this paper, we introduce a 3D fault directional skeletonization workflow (Figure 1) that uses the dip magnitude and azimuth of a directional Laplacian of a Gaussian (LoG) enhanced discontinuities image. We begin our paper by using principal-component SOF to suppress the random and steeply dipping coherent noise on the seismic amplitude data. Then, we compute the coherence attribute from the original and filtered seismic amplitude volumes and compare the results. Next, we apply a directional LoG filter resulting in a smooth but somewhat blurred image. Finally, we skeletonize the LoG filtered image perpendicularly to sharpen the locally planar features.

A workflow to skeletonize faults and stratigraphic features Figure 1
Figure 1. Workflow illustrating the steps used in our directional skeletonization workflow. The interpreter begins with poststack data conditioning by applying SOF on seismic amplitude data. After filtering, a coherence or other edge-detection attribute is computed. A directional LoG filter produces volume estimates of the probability, dip magnitude, and dip azimuth of locally planar events. These events are then skeletonized to produce sharper images.

Methods
Poststack data conditioning

Seismic attributes quantify patterns seen among neighboring seismic samples and traces to extract subtle features valuable for interpretation. For this reason, minor improvements of poststack amplitude data can significantly improve subsequent attribute imges. In this workflow, we use a Karhunen-Loève (principal-component) filter aligned with a structure to suppress random and any crosscutting coherent noise. Each voxel has an estimate of coherence. Of all the overlapping windows that contain our analysis point, we choose the window that is most coherent (Davogustto and Marfurt, 2011). Within this window about an analysis point ul at time t, we compute the covariance matrix Cij:Equation 1 (A Workflow to Skeletonize Faults and Stratigraphic Features)

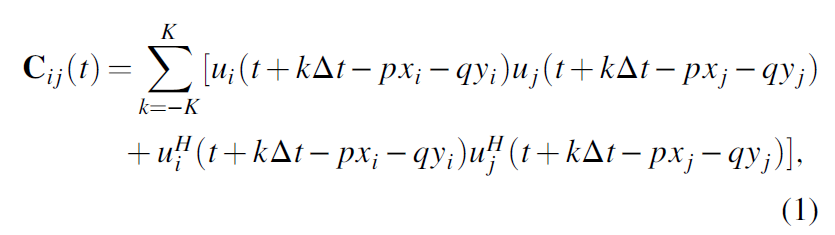
where ui and uj indicate the ith and jth trace, xi and yi (xj and yj) are the distance along the x– and y-axes of the ith (jth) trace from the analysis point, p and q are the apparent dip in the x– and y-direction measured in s∕m, and superscript H denotes the Hilbert transform. The samples along the structural dip for a fixed value of k form what is called a sample vector. The first eigenvector v1 of the matrix C best represents the lateral variation in each of the sample vectors. Crosscorrelating this eigenvector with the sample vector that includes the analysis point gives a crosscorrelation coefficient β:

Equation 2 (A Workflow to Skeletonize Faults and Stratigraphic Features)

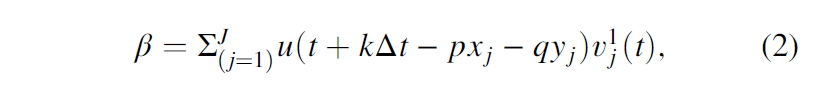
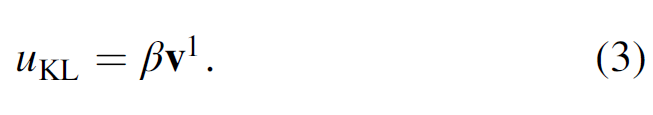
and the KL-filtered (or first principal component) of the data uKL at time t is then a scaled version of the eigenvector v1:

Equation 3 (A Workflow to Skeletonize Faults and Stratigraphic Features)

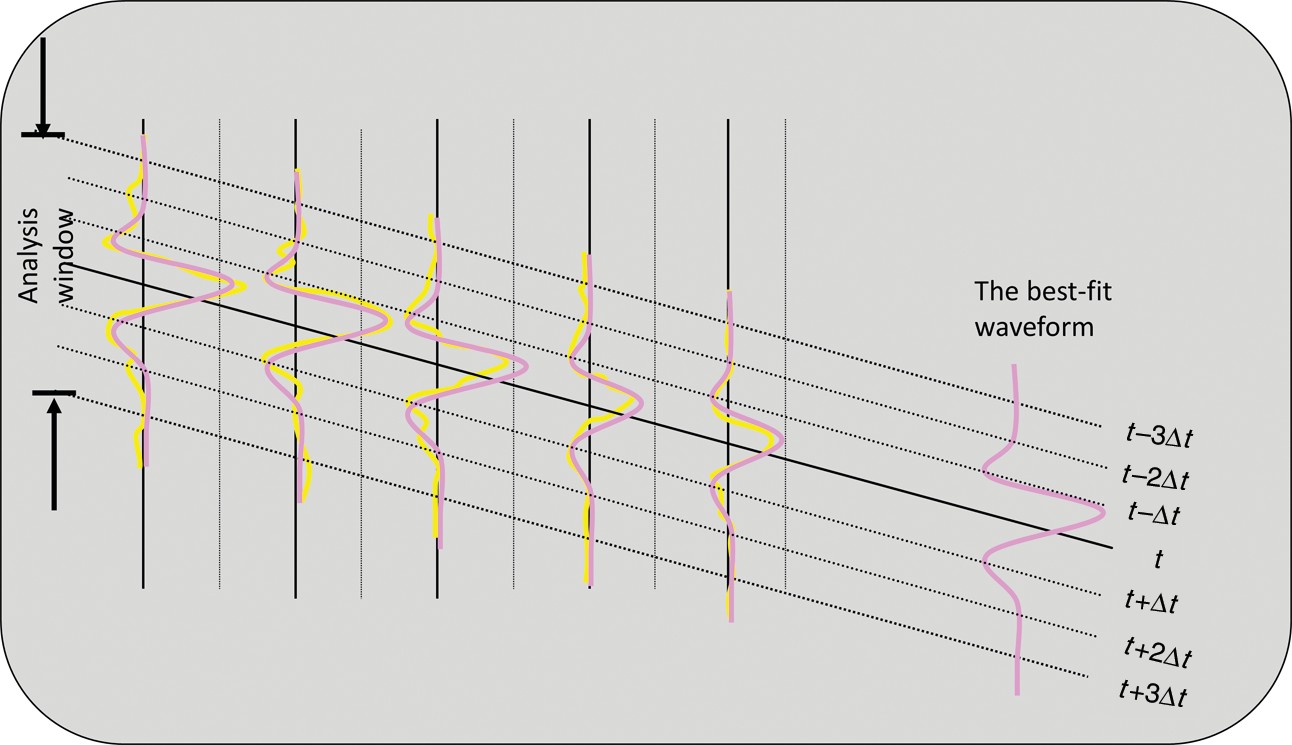
The “Kuwahara” window is in general laterally and vertically not centered about the analysis point ul. An analysis window of five traces and seven interpolated sample vectors, u t    kΔt is shown in Figure 2. Note that in this cartoon, the wavelet amplitude of the three leftmost traces is approximately two times larger than that of the two rightmost traces. Each sample vector approximately reflects a scaled version of the pattern (2, 2, 2, 1, 1), where the scaling factor can be positive for a peak, negative for a trough, or zero for a zero crossing. The first eigenvector for this cartoon will be a unit length vector representing this pattern:

Equation 4 (A Workflow to Skeletonize Faults and Stratigraphic Features)

Projecting the central sample vector at time t against the eigenvector v1 gives a crosscorrelation coefficient β. For SOF, one scales v1 by β giving the KL-filtered version of the seismic data. Note that because the covariance matrix is used to compute the first eigenvector from seven sample vectors, the statistical analysis involves seven times as much input data as for a simple mean filter. Furthermore, by using the laterally varying eigenvector, one better preserves the lateral change in amplitude in the original data.

Coherence

Coherence is an edge-detection attribute, and it measures lateral changes in the seismic waveform and amplitude. There are several popular coherence algorithms, including those based on semblance (Marfurt et al., 1998), eigenstructure (Gersztenkorn and Marfurt, 1999), the gradient structure tensor method (Bakker et al., 1999), and the Sobel filter (Luo et al., 1996; Luo, 2002). In our workflow, we use an energy ratio coherence of J traces in a K sample analysis window defined as the ratio between the energy of the coherent (KL-filtered data, uKL) to the energy of the unfiltered (or total data, u) within the analysis window centered about the analysis point:

Equation 5 (A Workflow to Skeletonize Faults and Stratigraphic Features)

where the coherent energy Ecoh (the energy of the KL-filtered data) is

Equation 6 (A Workflow to Skeletonize Faults and Stratigraphic Features)

the total energy Etotal of unfiltered data in the analysis window is

Equation 7 Stratigraphic Features

and where a small positive value ε prevents division by zero, and superscript H denotes the Hilbert transform. Application of a Hilbert transform of seismic data avoids unstable estimates of the covariance matrix for small vertical windows centered about a trace zero crossing (Marfurt, 2006). We applied the technique to volumes using a semblance and Sobel-filter algorithm, as well as the energy- ratio coherence algorithm all of which are computed along the structural dip. There is no significant difference for the larger, through-going faults. As expected, small discontinuities that are better delineated by energy-ratio coherence provide greater details. In contrast, if there is a footprint in the coherence images, skeletonization will sharpen it.

A workflow to skeletonize faults and stratigraphic features Figure 2
Figure 2. Cartoon of an analysis window with five traces and seven samples. Note that the wavelet amplitude of the three left most traces is approximately two times larger than that of the two right- most traces.
Fault enhancement

The goal of fault enhancement is to suppress incoherent noise and enhance faults trends. Although coherence highlights faults and channel edges, these fault images may be broken. A normal fault plane defines the surface between the footwall and the hanging wall (Figure 3). Following Barnes (2006) and Machado et al. (2016), in an N-voxel (αn) spherical analysis window, the second-order mo- ment tensor A of the discontinuity data αnðx1; x2; x3Þ is

Equation 8 (A Workflow to Skeletonize Faults and Stratigraphic Features)

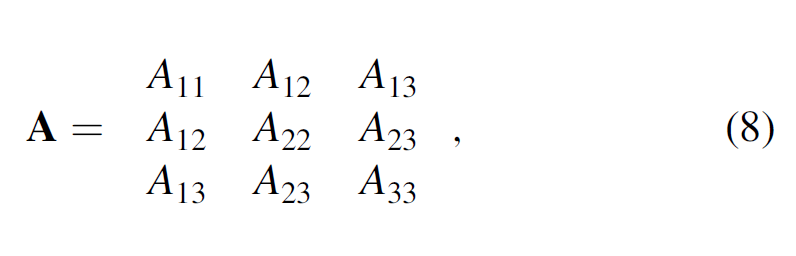
where the elements Aij

Equation 9 (A Workflow to Skeletonize Faults and Stratigraphic Features)

A workflow to skeletonize faults and stratigraphic features Figure 3
Figure 3. Cartoon of a normal fault defined by the eigenvector v3 perpendicular to the fault plane. The projection of v3 on the horizontal plane de- fines the fault-dip azimuth φ, and the angle be- tween v3 and the z-axis defines the fault-dip magnitude.

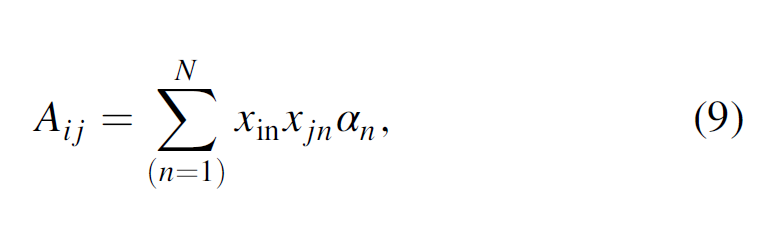
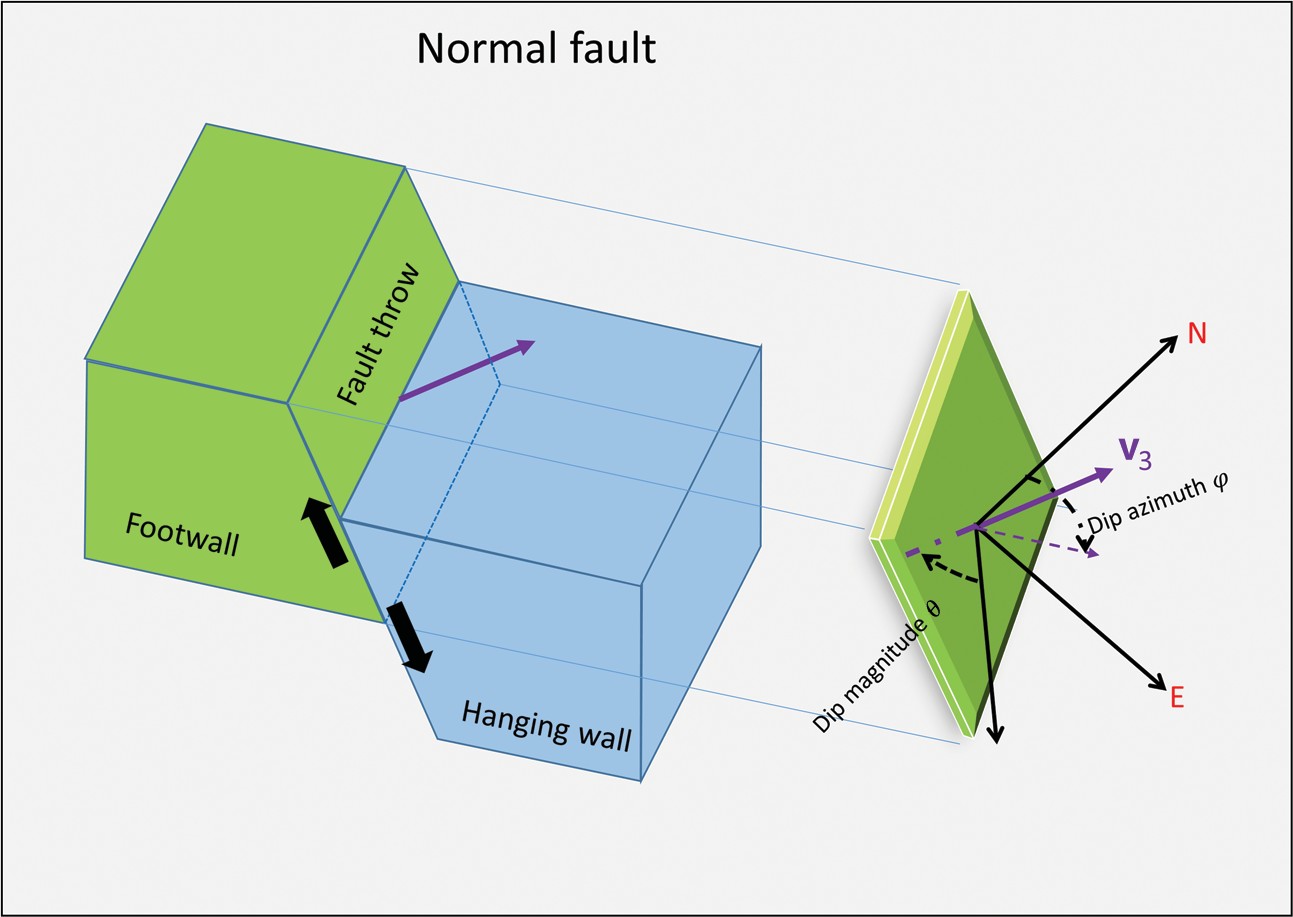
where xin are the distances from the center of the analysis window. If the input coherence data are computed from time-migrated data, z-axis should be stretched to depth. For planar coherence anomalies, the three eigenvalues i of the second moment tensor A will have 123. The eigenvectors v1 and v2 of the second-order moment tensor represent the planar surface, whereas the eigenvector v3 represents the normal to the planar surface. The eigenvector v3 has three components with v31 positive to the north, v32 positive to the east, and v33 positive down (Figure 3). Machado et al. (2016) apply a directional LoG operator to 3D seismic data to smooth along and sharpen the faults perpendicular to locally planar events. The Gaussian smoother is elongated along the plane (defined by the eigen- vectors v1 and v2)

Equation 10 (A Workflow to Skeletonize Faults and Stratigraphic Features)

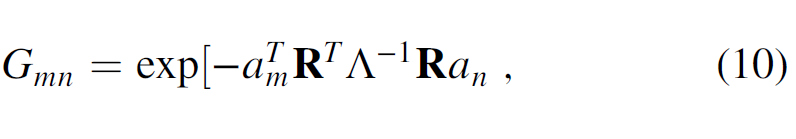
where R is the rotation matrix and defined as ½ v1 v2 v3 . The function Λ is a diagonal matrix and is defined as

Equation 11 (A Workflow to Skeletonize Faults and Stratigraphic Features)

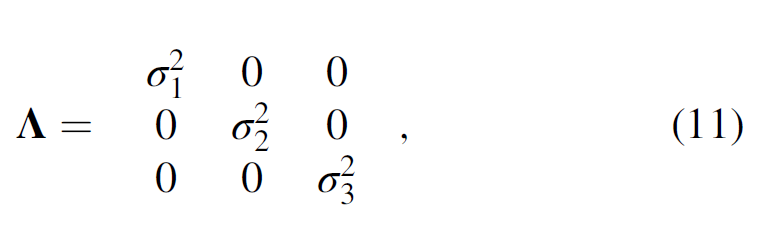
where the value of σ1 and σ2 is three times the bin size, and σ3 is the bin size. The rotation matrix R is aligned with the eigenvector v3. Thus, the second derivative of the Gaussian in the eigenvector v3 direction (ξ3) is

Equation 12 (A Workflow to Skeletonize Faults and Stratigraphic Features)

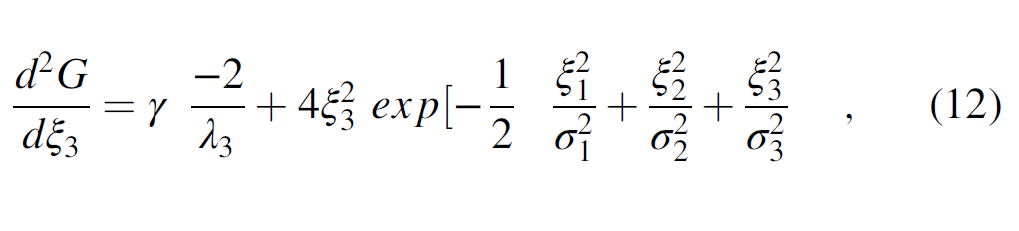
where ξ1, ξ2, and ξ3 are aligned along the eigenvector v1, v2, and v3, respectively, and γ is a normalization factor. Because the directional LoG filter is based on a Gaussian distribution function, we call our filtered result a “fault-probability” image.

Fault skeletonization

Finding eigenvector v3 is the key to directionally skeletonizing planar anomalies in coherence images (Qi et al., 2016). For each voxel, we extract 26 neighboring samples of fault probability that fall within a    dx      dy      dz gridded window (Figure 4). Figure 4a shows a hypothesized plane in green, intersecting the center of the window at point U14.

A workflow to skeletonize faults and stratigraphic features Figure 4
Figure 4. Cartoon showing details of directional skeletonization. (a) The analysis window about each voxel consisting of eight subcubes and 26 neighboring voxels. The green plane indicates a locally planar event with center point U14. Uleft and Uright define points at which the eigenvector v3 intersects the analysis window. The attribute value at Uleft is interpolated from the corner values of the red square U11, U12, U20, and U21. The attribute value at Uright is interpolated from the corner values of the blue square U7, U8, U16, and U17. (b) Further interpolation along axis v3 by fitting the parabola to U14. Uleft and Uright to estimate the maximum value Umax and its location.

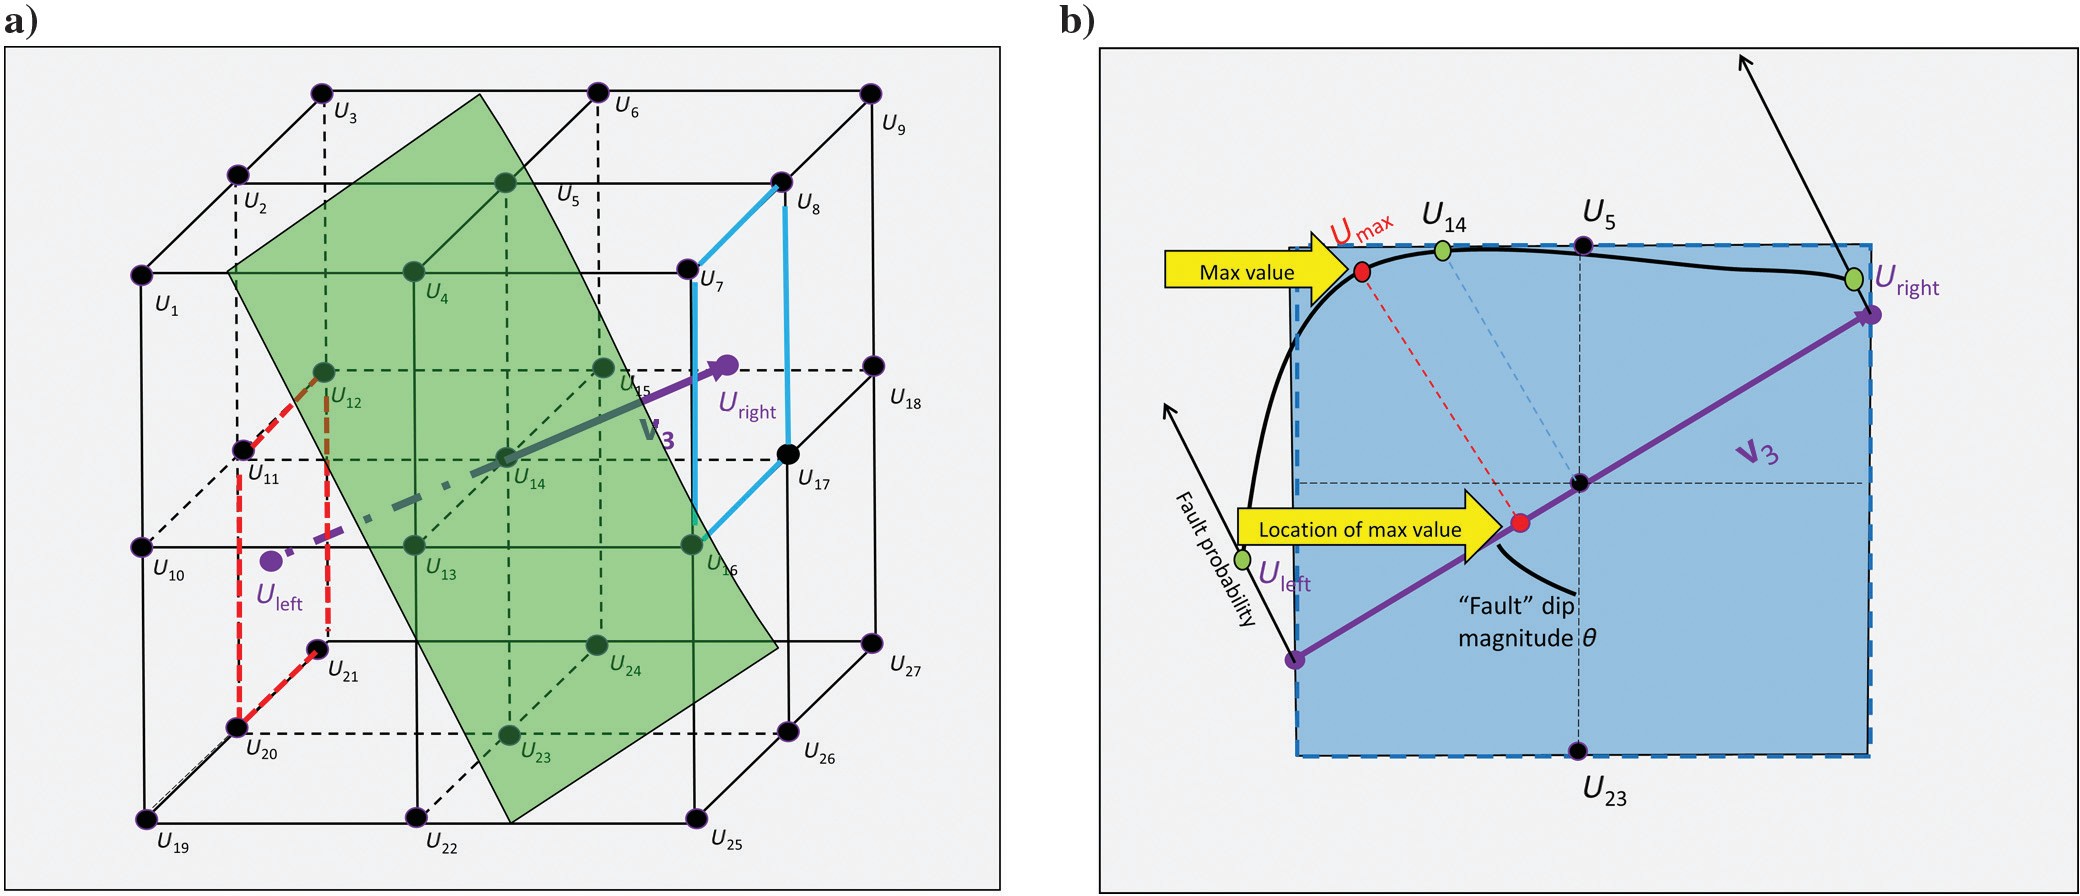
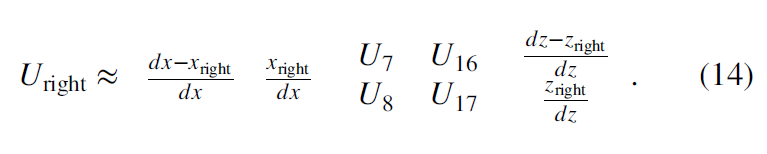
The intersection of v3 with this window gives the locations (Uleft, Uright), which fall in the 2D red and blue rectangles, and they are then interpolated from the neighboring grid points. We assume the center analysis point U14 is at (0, 0, 0) and the point U1 is at (−dx, −dy, −dz). Values of interpolated points Uleft and Uright in the analysis window (Figure 4) are
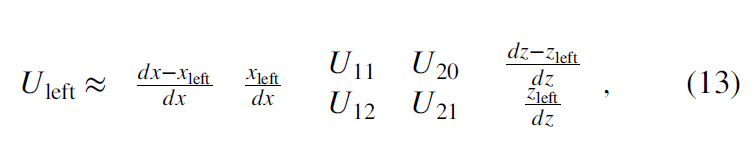
Equation 13 (A Workflow to Skeletonize Faults and Stratigraphic Features)

and

Equation 14 (A Workflow to Skeletonize Faults and Stratigraphic Features)

If the value at the center of the analysis window, U14 < Uleft or U14 < Uright, no fault maximum occurs and we set the skeletonized value to be zero. If the value at the center of the analysis window, U14Uleft and U14Uright, a fault anomaly falls within the window. We fit a parabola of the form

Equation 15 (A Workflow to Skeletonize Faults and Stratigraphic Features)

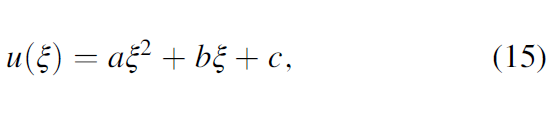
to the value Uleft, U14, and Uright (Figure 4b). The maximum value Umax and distance ξmax between U14 and location of Umax projection on the eigenvector v3 is

Equation 16 (A Workflow to Skeletonize Faults and Stratigraphic Features)

Equation 17 (A Workflow to Skeletonize Faults and Stratigraphic Features)

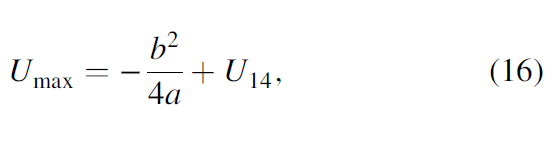
where a and b are defined as

Equation 18 (A Workflow to Skeletonize Faults and Stratigraphic Features)

Equation 19 (A Workflow to Skeletonize Faults and Stratigraphic Features)

where d is the half-length between U left and U right. In general, Umax does not fall on the grid point U14, such that we need to distribute the Umax value into the eight neighboring grid points and the weights functions wk are based on their distance between the Umax and eight neighboring grid points:

Equation 20 (A Workflow to Skeletonize Faults and Stratigraphic Features)

In Figure 5, Umax falls with a subcube of the grid-analysis window, indicated by the dashed red line. We compute skeletonized values on eight neighboring grid points whose weighted average produces the fault probability at the maximum location. Finally, all skeletonized values on the grid points will be output to the skeletonized image.

A workflow to skeletonize faults and stratigraphic features Figure 5
Figure 5. Cartoon showing the location of Umax in 3D. In general, Umax does not fall on a voxel, such that Umax needs to be distributed to its eight neigh- boring grid points for subsequent displays.

Figure 6 shows a normal fault before and after our directional skeletonization workflow. Coherence fault anomalies appear broken on the time slice (Figure 6b), whereas “stair-step” artifacts appear on the vertical slice. Fault-dip azimuth φ and fault-dip magnitude θ, which are computed from the eigenvector v3 indicate the direction of skeletonization, with the result shown in Figure 6. After this workflow, faults become sharper and more continuous. Stratigraphic features are also preserved, and these can be used to estimate fault throws that are indicated by the blue arrows in Figure 6c. Lateral discontinuities, such as shale-dewatering syneresis, are enhanced after our workflow that is indicated by yellow arrows.

A workflow to skeletonize faults and stratigraphic features Figure 6
Figure 6. Examples of two normal faults seen on a time and vertical slice through (a) the original seismic amplitude volume, (b) the coherence volume, and (c) the directional skeletonization volume. The purple arrow indicates the eigenvector v3 in the vertical slice, whereas the dashed purple arrow indicates its projection on the time slice. Fault-dip azimuth φ and fault-dip magnitude θ are illustrated in (b). Fault anomalies exhibit the well-known stair-step artifacts, such that fault planes are disconnected. After our directional skeletonization workflow, faults be- come sharper and more continuous. Stratigraphic features are preserved, which can be used to estimate fault throws that are indicated by the blue arrows in (c). Lateral discontinuities are also enhanced after our workflow those are indicated by the yellow arrow in (c).
Application

Gulf of Mexico (GOM3D)

We first apply our workflow to a 3D seismic data set in the Gulf of Mexico (GOM3D). The seismic data were acquired by Petroleum Geo-Services (PGS) using towed streamer acquisition with two sources and three receiver cables with a maximum offset of 6000 m. The data set within the inline and crossline spacing of 37.5 × 12.5 m (123.1 × 39.4 ft), covers more than 253 km2 (2723.27 ft2), and has been prestack time migrated. The uplift of the western salt dome is contemporaneous with the upper minibasin fill, and it occurred earlier than the eastern salt dome rise. Structural and stratigraphic features, such as salt domes, mass transport complexes (MTCs), and undeformed sediment and shale, are major seismic facies in this area. Figure 7 displays a time slice at 1 s and a vertical slice AA′ through the seismic amplitude volume. Random and coherent noise overprint reflectors in the migrated data set. After principal-component SOF (Figure 7c and 7d), the signal- to-noise ratio (S/N) of lateral and vertical discontinuities has increased, as seen in the clearer faults and block delineation within the MTCs. Figure 7e and 7f shows the rejected noise.

A workflow to skeletonize faults and stratigraphic features Figure 7
Figure 7. (a) Time slice at t ¼ 1 s and (b) vertical slice along line AA′ through the original seismic amplitude volume in the GOM3D survey. (c) Time slice at t ¼ 1 s and (d) vertical slice along line AA′ through the seismic amplitude volume after SOF. (e) Time slice at t ¼ 1 s and
(f) vertical slice along line AA′ through the rejected “noise” volume. Note that the seismic amplitude volume after SOF shows a better S/N. All images are at the same scale amplitude.

Figure 8 shows the comparison of coherence before and after principal component SOF. Salt domes and MTCs exhibit a “salt-and-pepper” pattern in the coherence volume. Figure 8c and 8d shows that coherence computed after filtering preserves lateral and vertical discontinuities, and suppresses random and coherent noises. Coherence computed from the SOF seismic amplitude volume exhibits a better S/N. Small cross faults and other discontinuities within the MTCs are clearly imaged at the time (Figure 8c) and vertical slices (Figure 8d) through coherence. However, fault anomalies still exhibit the stair-step artifacts.

A workflow to skeletonize faults and stratigraphic features Figure 8
Figure 8. (a) Time slice at t 1 s and (b) vertical slice along line AA′ through coherence computed from the original seismic amplitude volume. (c) Time slice and (d) vertical slice through coherence computed from the SOF seismic amplitude volume. Note that low coherence values parallel to weak low S/N reflectors are suppressed. Thoroughgoing normal faults and localized discontinuities internal to the MTCs are slightly enhanced. The red polygon indicates a salt dome.

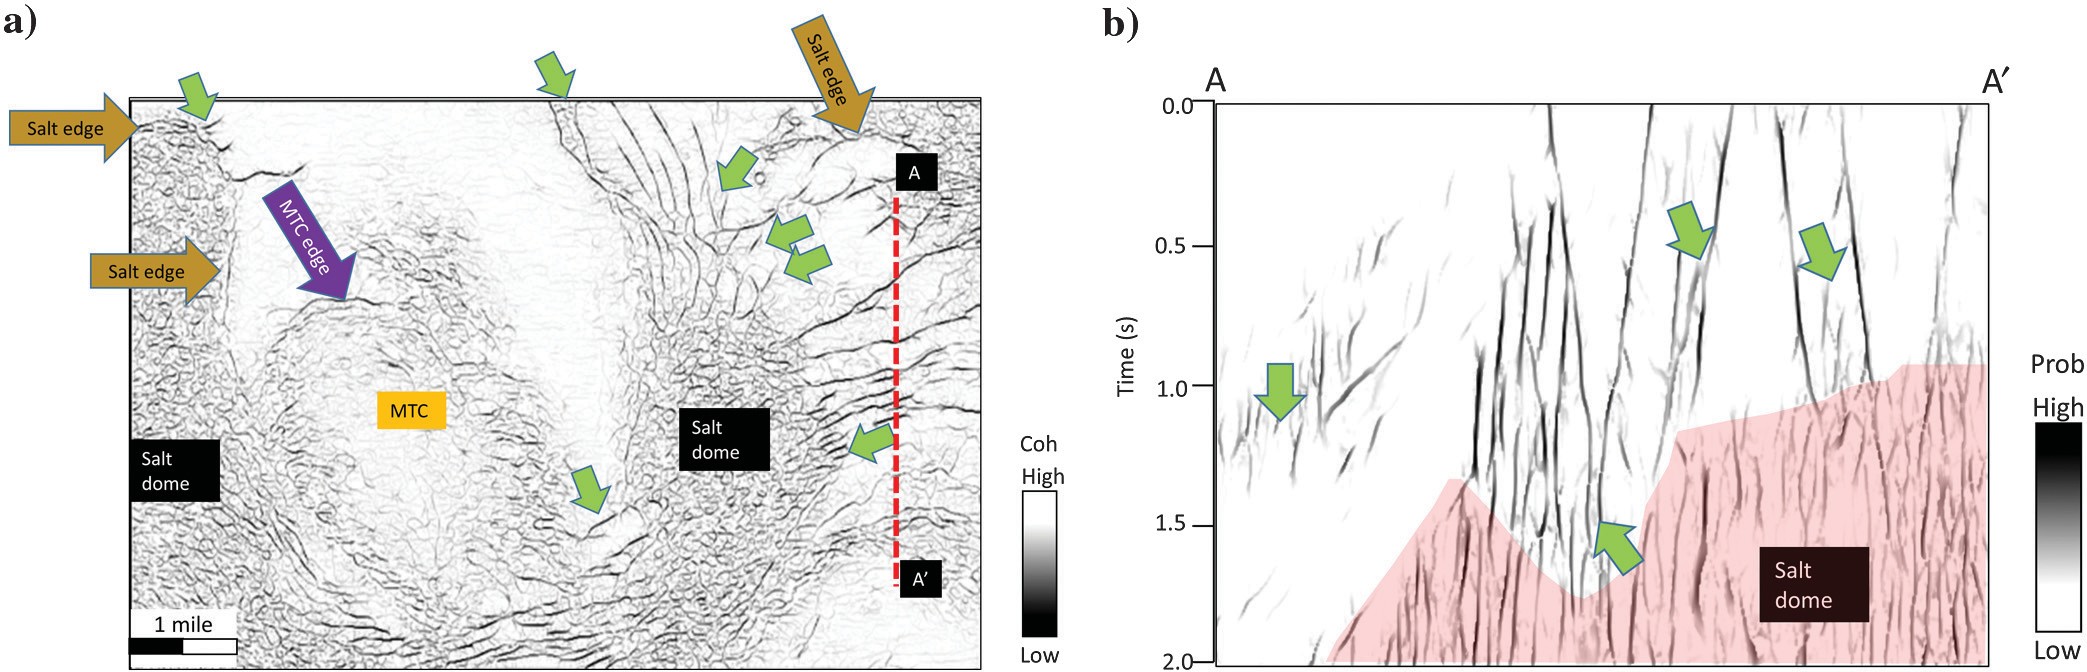
Figure 9a and 9b shows directionally skeletonized coherence images. Fault anomalies are now more continuous, exhibit higher contrast, with reduced stair-step artifacts. Salt edges, MTC edges, and many subtle faults (indicated by the green arrows in Figure 9) are enhanced in the time and vertical slices. The noise that does not represent locally planar discontinuities is suppressed during the skeletonization step.

A workflow to skeletonize faults and stratigraphic features Figure 9
Figure 9. (a) Time slice at t 1 s and (b) vertical slice along line AA′ through the directionally skeletonized fault-probability attribute. Note that faults after our workflow are more continuous, with higher contracts. Subtle features within the MTC are also enhanced. Stair-step artifacts in the faults have been reduced, and anomalies parallel to stratigraphy are suppressed.

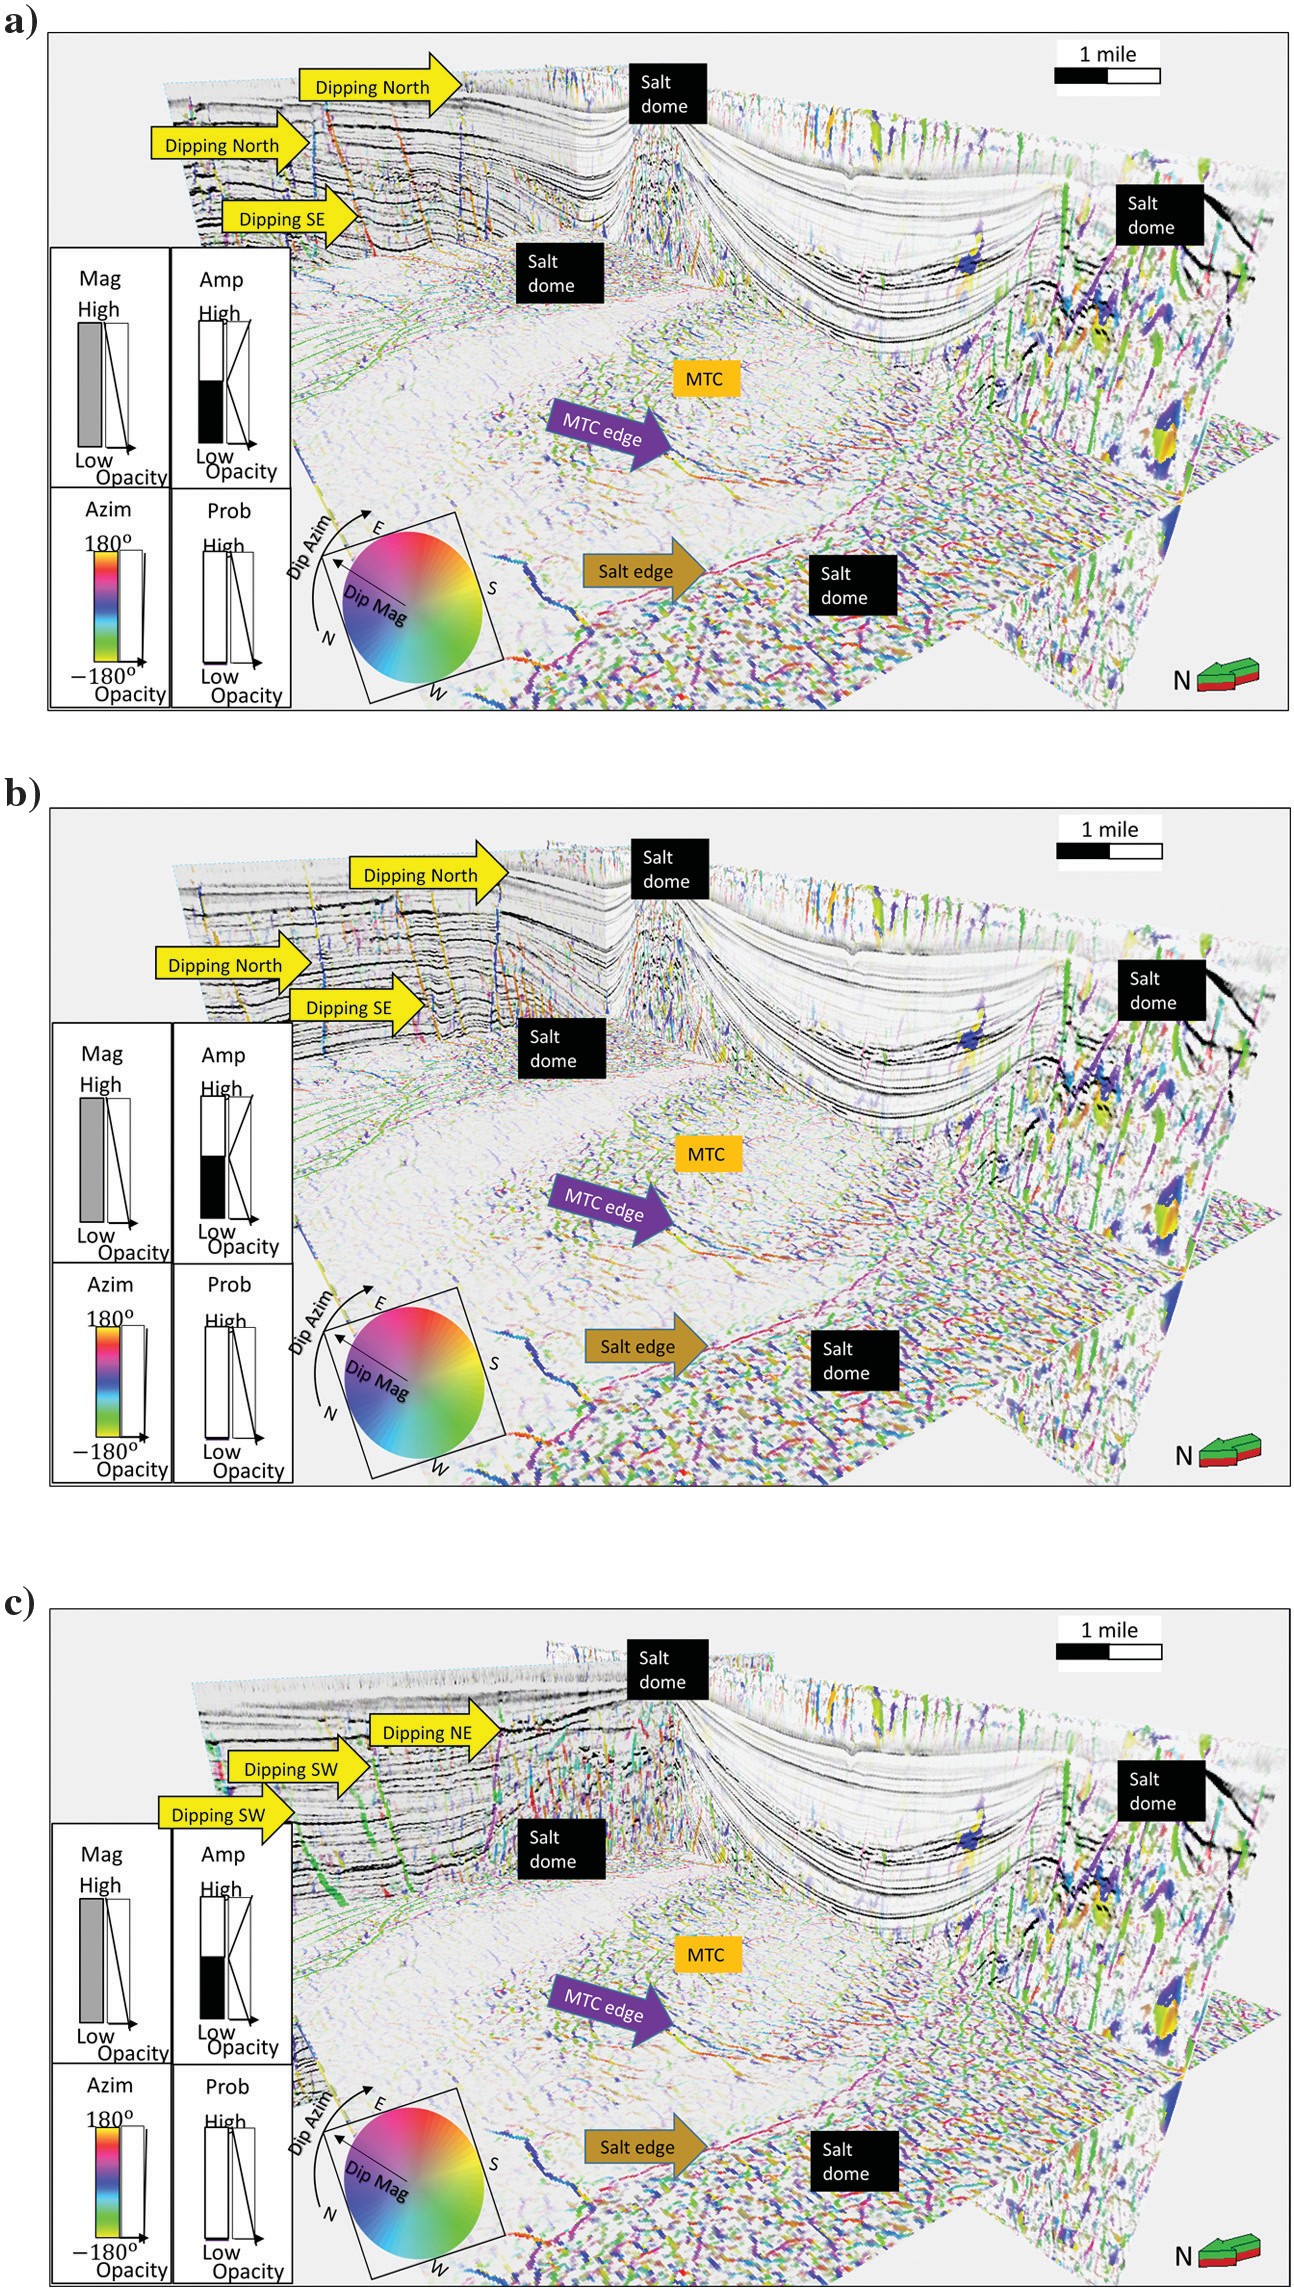
In Figure 10, we use the hue-lightness-saturation (HLS) color model to corender the fault-dip magnitude (against S), the skeletonized fault probability (against L), and the fault-dip azimuth (against H). In Figure 10, the fault orientation is readily seen. Numerical computation of fault probability and orientation at each voxel provide an easy way to identify fault sets, either visibly or through statistical analysis. Note that the coherent noise within the salt has been organized and should be interpreted as noise. More sophisticated processing produces homogeneous reflection salt images in this part of the Gulf of Mexico.

The S/N of this time-migrated data set was very low. We applied the workflow to this data set, and found significant improvement after applying our skeletonized fault probability workflow. However, there are still some spikes, which are poorly displayed. In terms of spikes, coherence values will always range between zero and one. For this reason, isolated spikes do not cause problems so long as they do not align with other spikes. The biggest limitation in applying attributes and skeletonization to this kind of data is that those interference phenomena corresponding to overlapping, poorly migrated events will give rise to discontinuities, which of course will then be sharpened. Such data limitations, including issues as basic as fault shadows, need to be properly addressed in the imaging algorithm, and they cannot be corrected by any data conditioning or image processing.

A workflow to skeletonize faults and stratigraphic features Figure 10
Figure 10. The 3D view showing several inlines of the directional skeletonization result corendered with seismic amplitude against the HLS. Faults orientation is readily seen. More organized artifacts now appear within the salt and should be ignored.

Gulf of Mexico (GOM3D)

Our second test data are from the Great South Basin, New Zealand. The intracontinental rift basin formed during the mid-Cretaceous and is divided into several highly faulted subbasins that contain very thick sedimentary fill. A polygonal fault system is very developed in the area, and its genetic mechanisms include gravity collapse, density inversion, syneresis, and compactional loading (Cartwright et al., 2003), whereas syneresis is also seen in the data set. The inline and crossline spaces are 12.5 m, and the time sample rate is 2 ms. Figure 11 shows the original seismic amplitude. We compute coherence from the seismic amplitude volume.

A workflow to skeletonize faults and stratigraphic features Figure 11
Figure 11. Time slice at (a) t ¼  1.3 s, and at (b) t¼ 1.72 s, and (c) a vertical slice along BB′ through the original seismic amplitude volume in the GSB3D survey. Polygonal faults developed in this area, as well as the syneresis features (less accurately referred to as shale dewatering) that appeared at t ¼ 1.72 s.

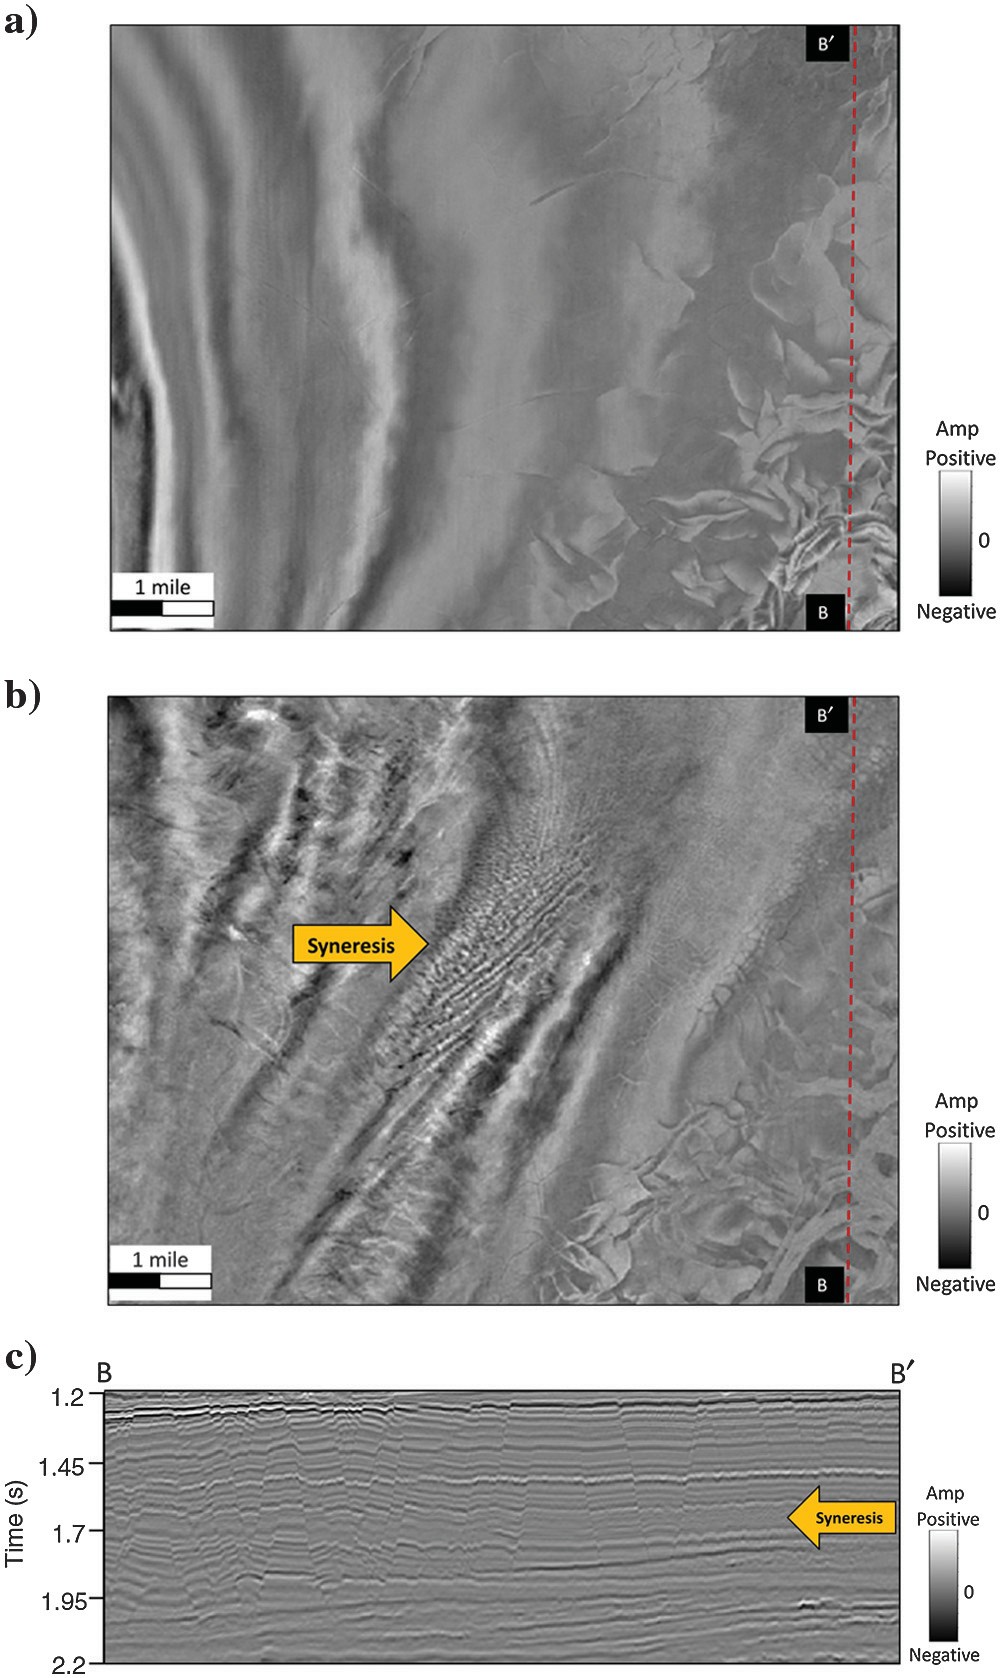
In Figure 12a, polygonal faults are well-delineated. However, the well-known stair-step artifacts are exhibited on the vertical slice (Figure 12c). The syneresis pattern (Figure 12b and 12c) is too chaotic to be interpreted. Fault trends in coherence are disconnected, especially on curved faults.

A workflow to skeletonize faults and stratigraphic features Figure 12
Figure 12. The same slices as shown in the previous figure through the coherence volume. Polygonal faults are well-delineated. Faults in (b) exhibit the well-known stair-step artifacts on the vertical slices. The syneresis pattern in (b) is too chaotic to be interpreted.

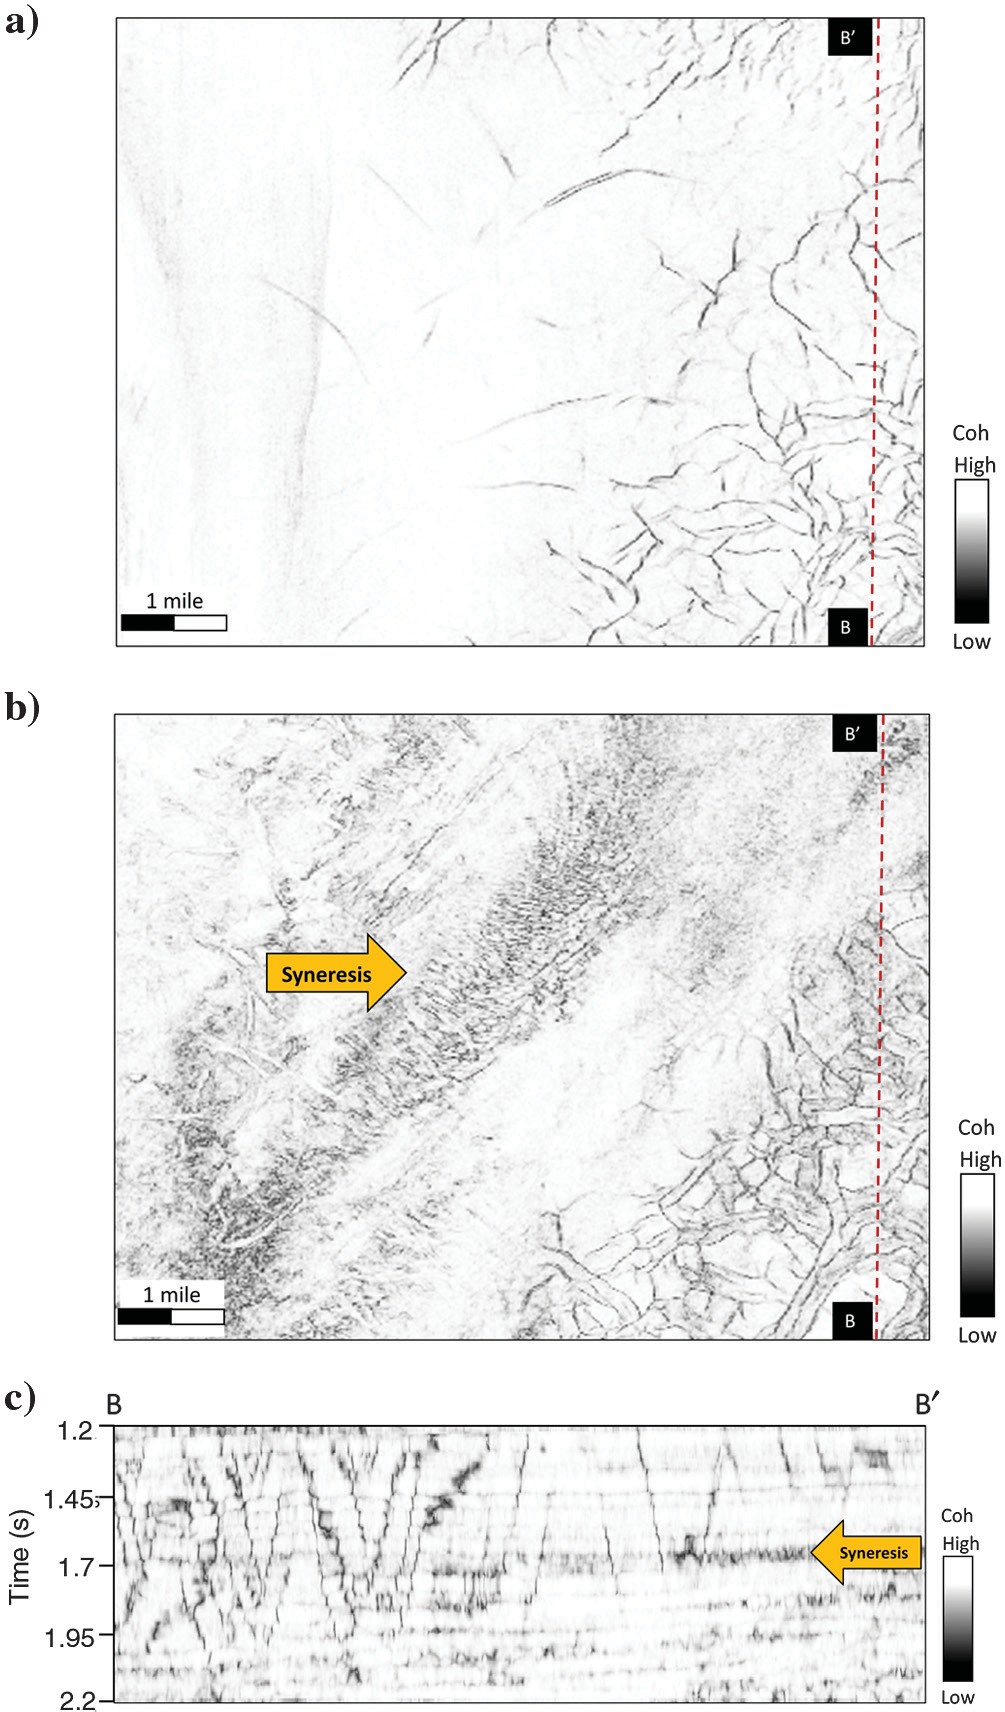
After our workflow (Figure 13), polygonal faults are sharper and more continuous, and stair-step artifacts have been suppressed. Syneresis and other stratigraphic features are also enhanced after skeletonization. The “thick” black smears correspond to faults subparallel to the vertical slices.

A workflow to skeletonize faults and stratigraphic features Figure 13
Figure 13. The same slices shown in the previous figure through the directionally skeletonized coherence volume. Compared with the original coherence images in the previous figure, the polygonal faults are sharper, and more continuous. Random noise is sup- pressed, and subtle faults and other discontinuities are enhanced. In the vertical slice, the fault stair-step artifacts have been attenuated, whereas syneresis discontinuities are enhanced. The thick black smears (orange arrows) correspond to faults subparallel to the vertical slice.

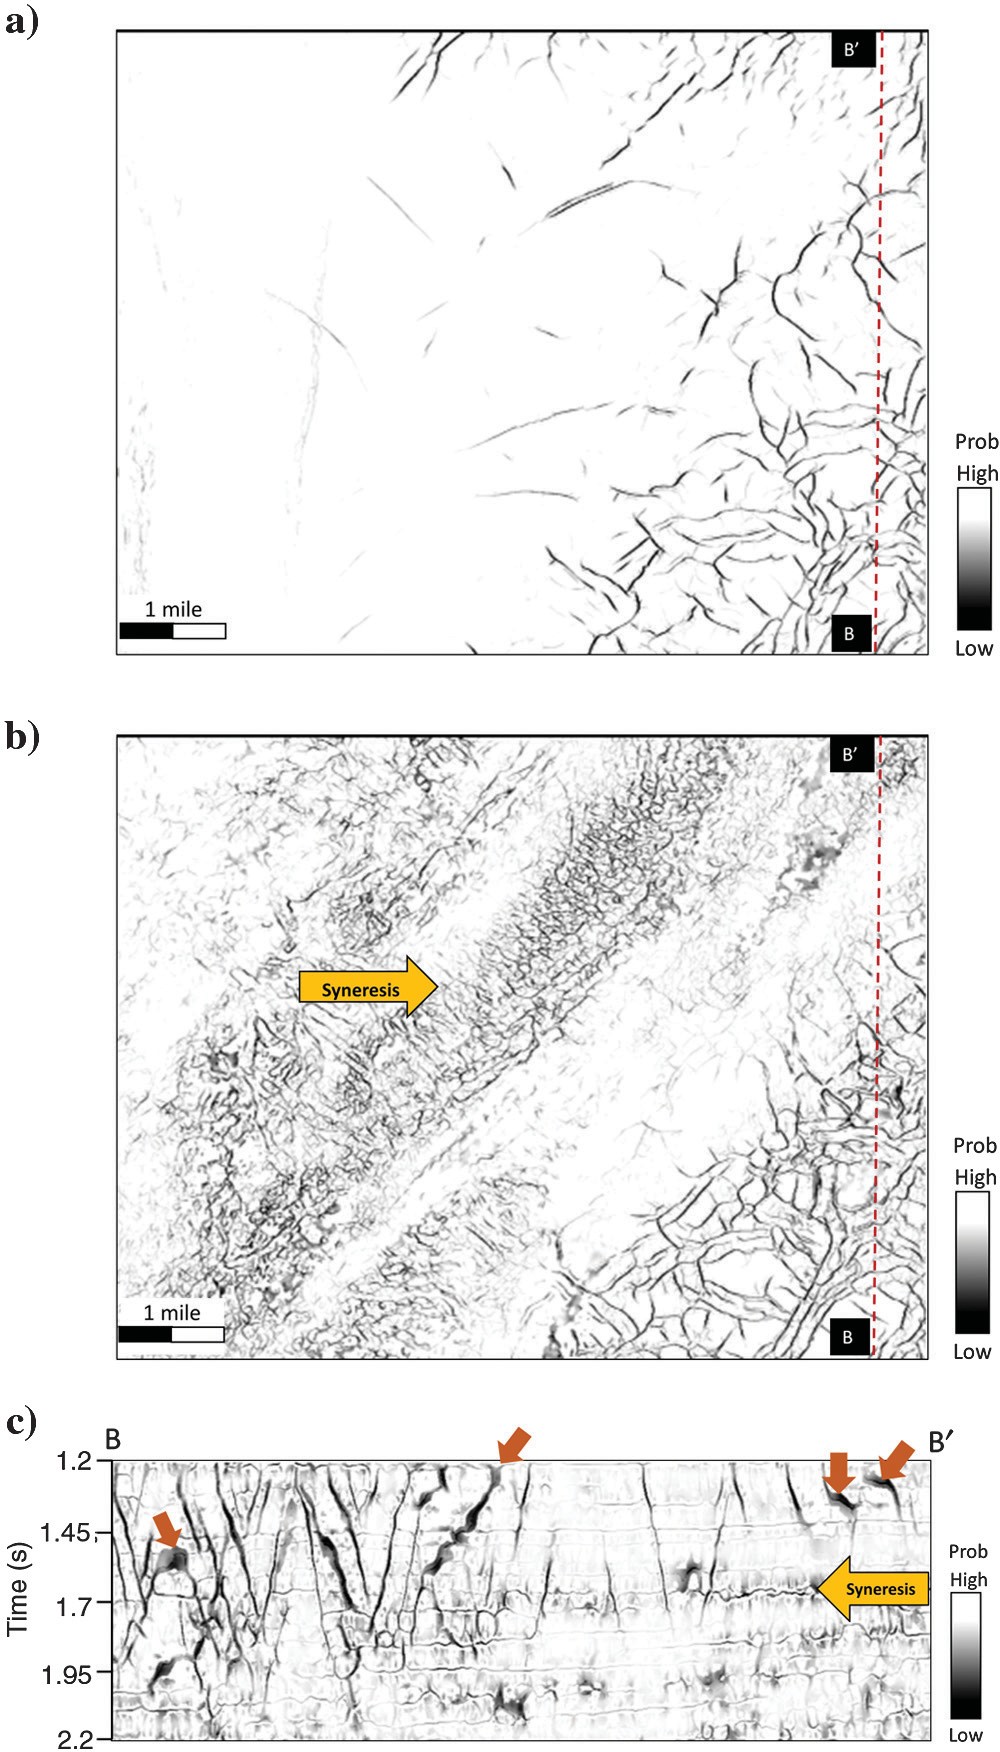
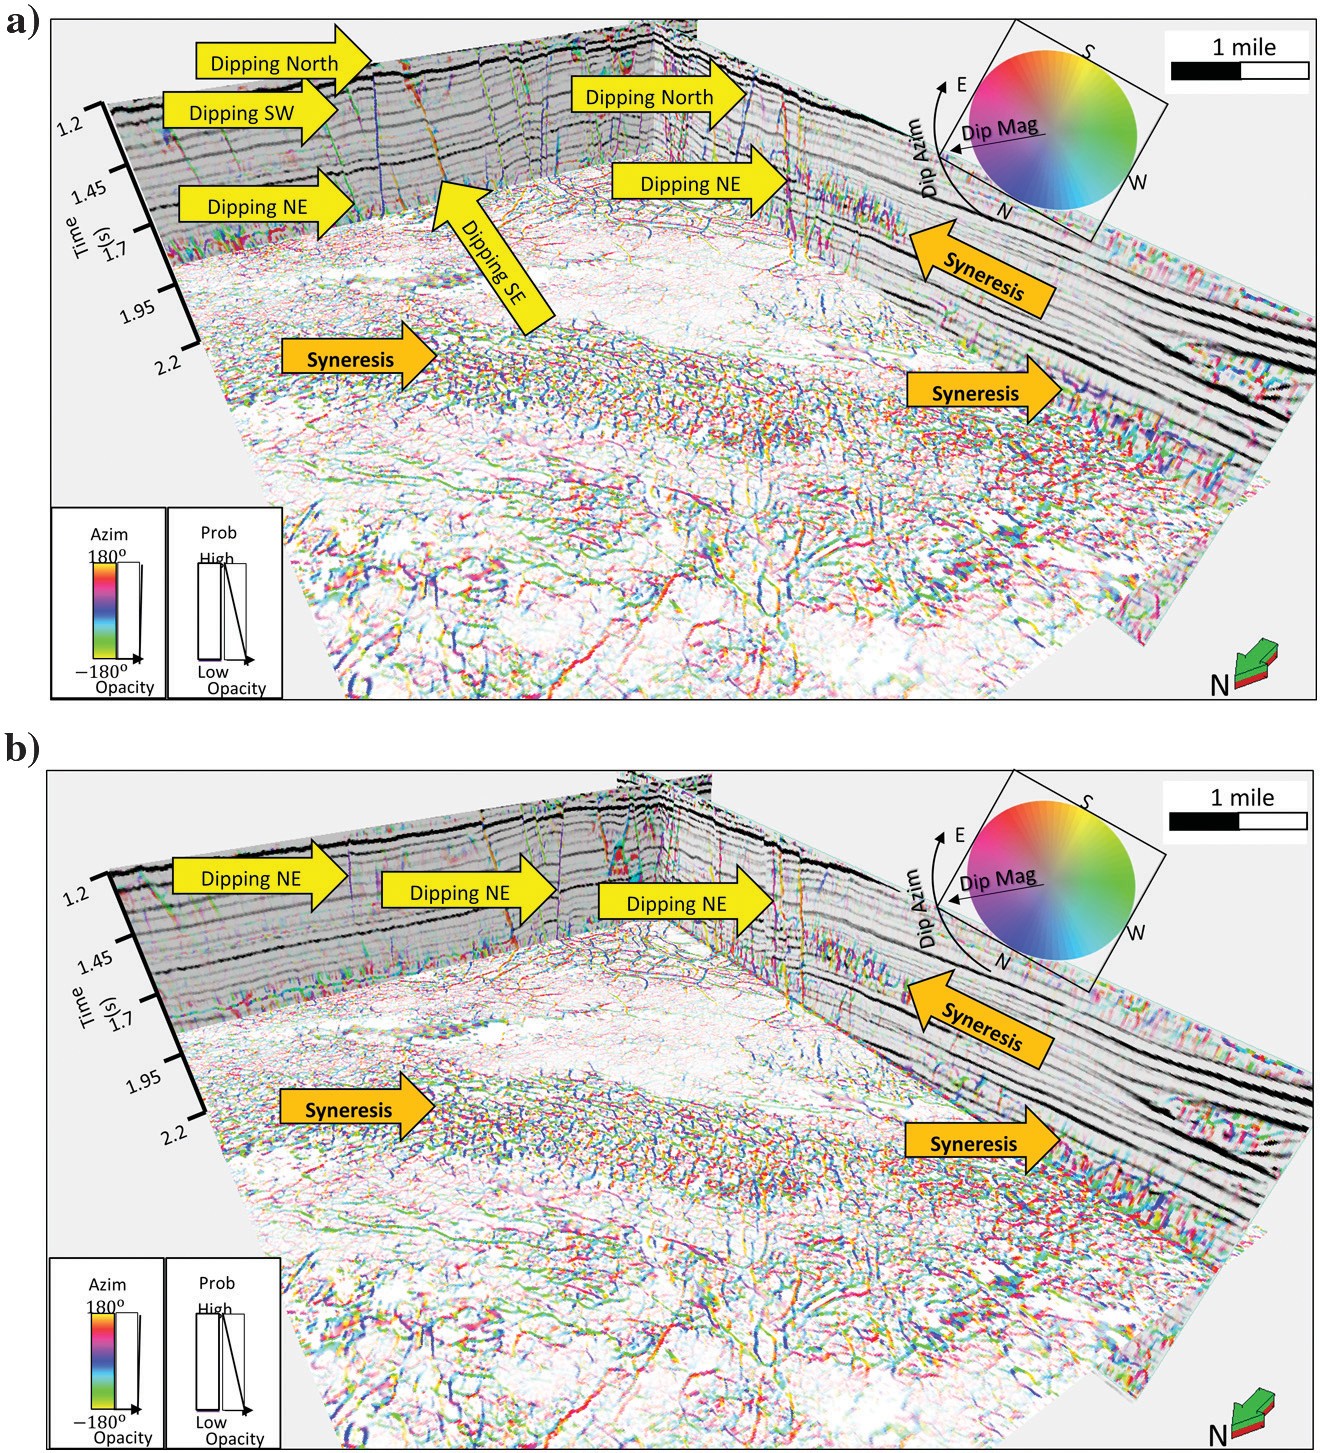
Figure 14 shows a 3D view of a skeletonized fault probability corendered with fault dip azimuth and seismic amplitude data. Note that polygonal fault planes and syneresis are preserved after directional skeletonization in the 3D volume, and fault planes associated with fault dip azimuth are readily identified. Lateral discontinuities, such as syneresis, are also seen.


A workflow to skeletonize faults and stratigraphic features Figure 14
Figure 14. A 3D view showing several inlines and crosslines of the directional skeletonization result corendered with seismic amplitude using HLS. Note that fault planes after directional skeletonization become sharper and are readily identified.

Comparison of directional skeletonization with swarm intelligence

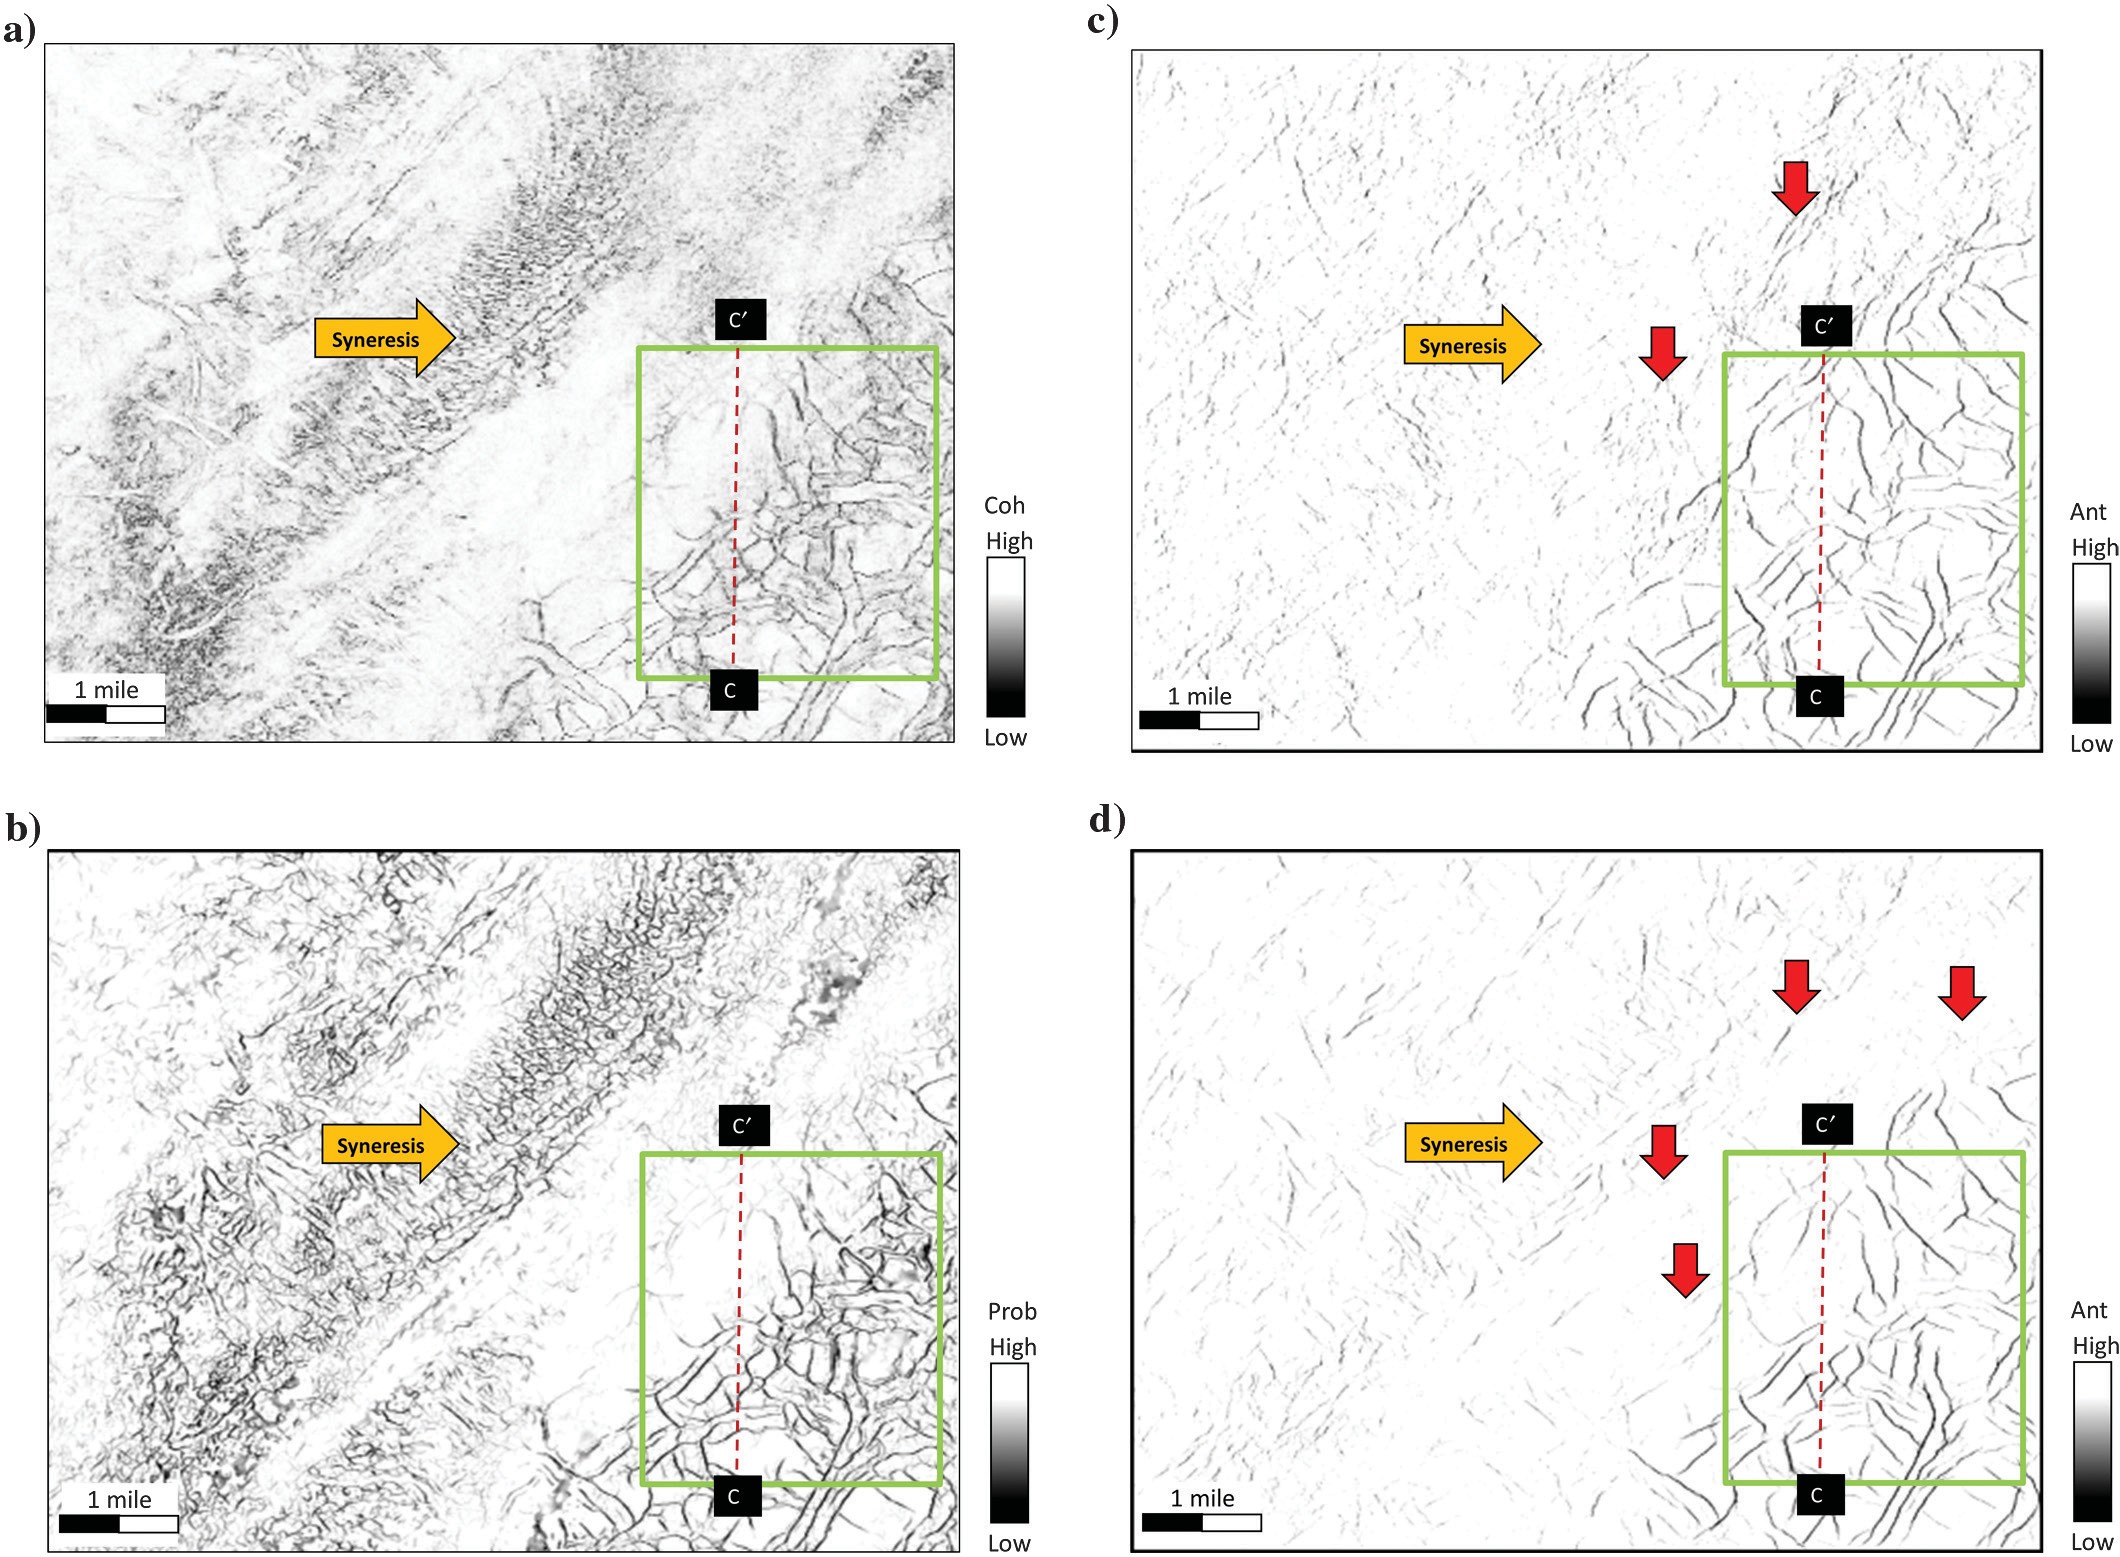
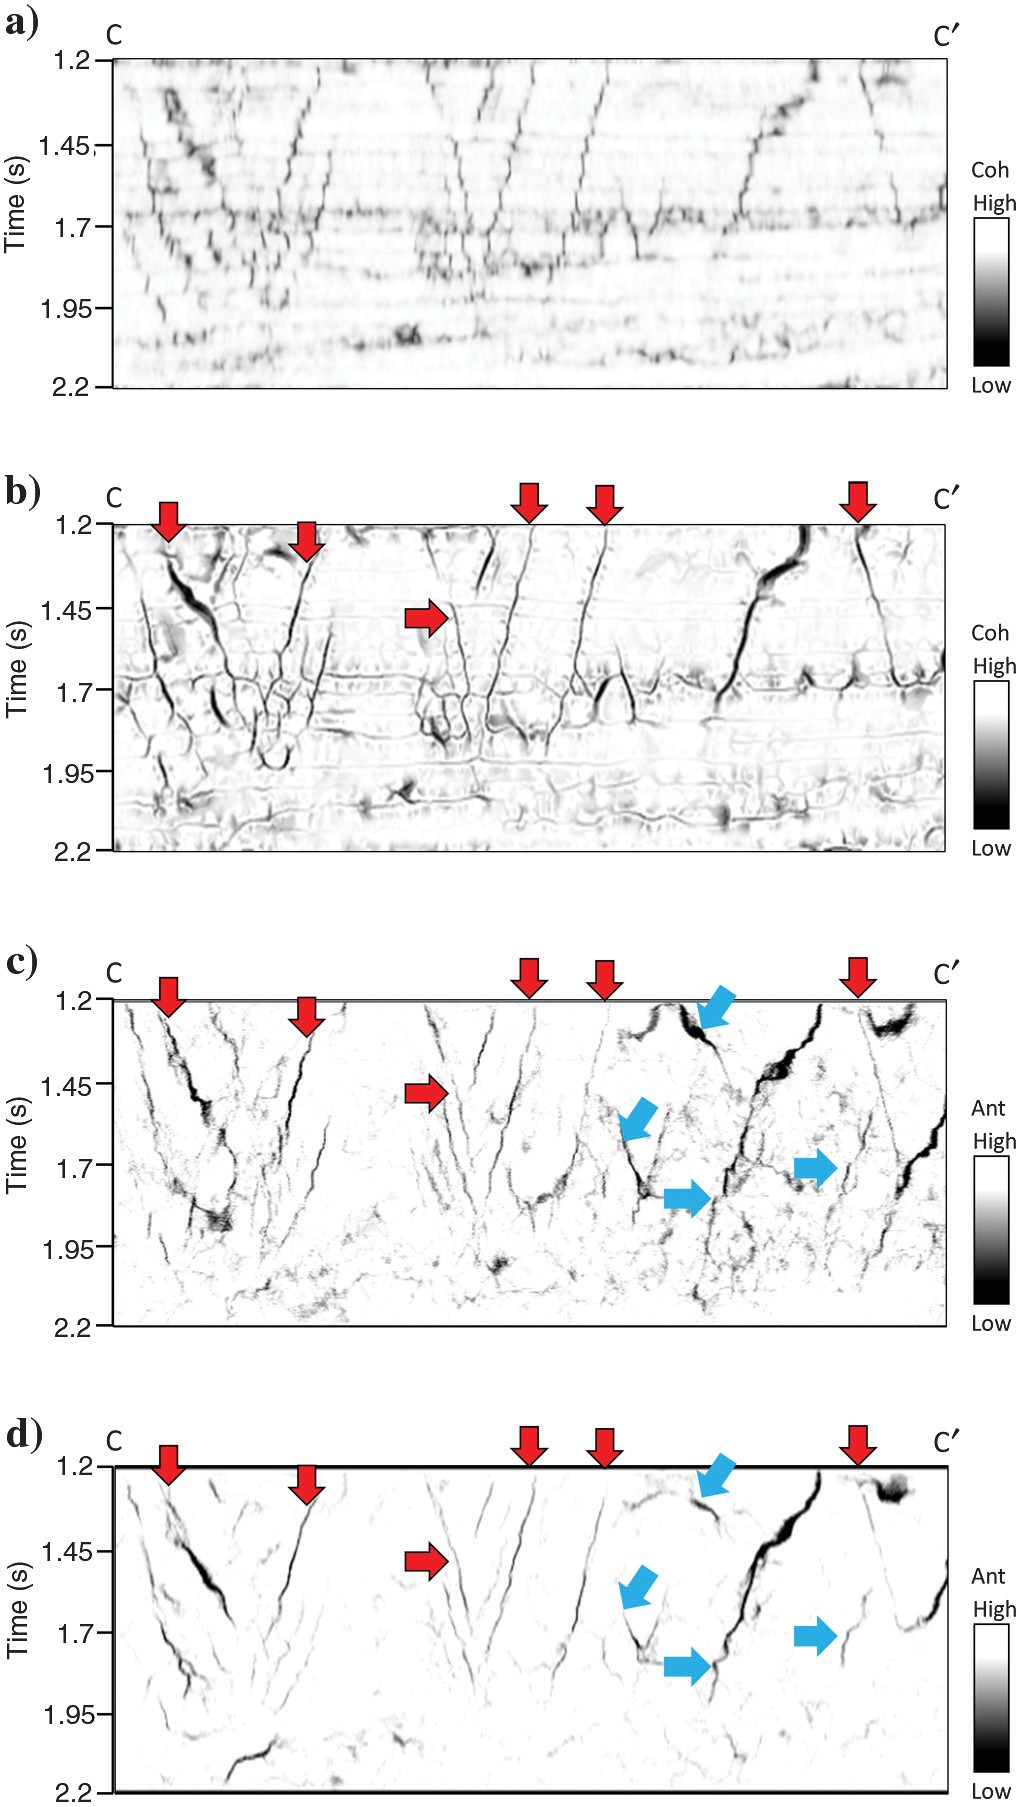
We apply our directional skeletonization method and swarm intelligence to the GSB3D survey, and we compare these results in fault and syneresis enhancement. Figure 15a shows a time slice at 1.72 s through the coherence volume that is used as the input for comparison of the two different methods. Polygonal faults (green rectangular) and syneresis (orange arrow) are present in this time slice. Figure 15b shows the directional skeletonization result, and Figure 15c shows the result of swarm intelligence, both computed from coherence. Note that, directional skeletonization shows more details (subtle faults) than does swarm intelligence in the polygonal fault zone. Swarm intelligence generates linear artifacts, but directional skeletonization does not, as indicated by the red arrows in Figure 15c and 15d. Figure 15d shows the swarm intelligence result with the directionally skeletonized volume as input. The results obtained by applying swarm intelligence to the directionally skeletonized data are better than those obtained from coherence, preserving more subtle discontinuities in the polygonal faults zone. However, despite applying many different combinations of parameters for swarm intelligence, the syneresis area could not be preserved (orange arrow). We conclude with Figure 16 showing the same volumes as in Figure 15 but on vertical slices.

A workflow to skeletonize faults and stratigraphic features Figure 15
Figure 15. Time slice at t 1.72 s through (a) coherence, (b) directional skeletonization, (c) swarm intelligence volumes computed with coherence as input, and (d) with directional skeletonization volumes as input. Note that skeletonization shows more subtle faults, has fewer artifacts, and preserves syneresis. Applying swarm intelligence to the skeletonized LoG image is better than that applied to coherence. The red arrows indicate artifacts generated by swarm intelligence.

The swarm intelligence result with directional skeletonization volume as input shows more continuous and sharper fault images than the one computed directly from coherence. The directional skeletonization workflow in Figure 16 exhibits fewer stair-step artifacts than those in Figure 16 (red arrows). The blue arrows indicate faults better mapped by swarm intelligence than by directional skeletonization, at the expense of organizing other features that are probably noise. Stratigraphic features are preserved and enhanced using the directional skeletonization workflow. Comparing Figure 16c with Figure 16d, we can see that swarm intelligence with directional skeletonization as input created fewer artifacts. Swarm intelligence and the skeletonization workflow need the edge-detection attribute as input. These two methods are sample-by-sample analysis, and the computation cost of these two methods is similar. For the data set GSB3D with 500 × 280 traces and 750 time samples, the enhancement and skeletonization take approximately 200 s. Applying the same data set to swarm intelligence, the computation time is approximately 220 s.

A workflow to skeletonize faults and stratigraphic features Figure 16
Figure 16. Vertical slices through (a) coherence, (b) directional skeletonization, and swarm intelligence volumes with (c) coherence as input, and (d) directional skeletonization volume as coherence as input. The skeletonization workflow in (b) exhibits fewer stair-step artifacts (red arrows) than those in (c and d). The blue arrows indicate that swarm intelligence maps faults to a greater extent than our directional skeletonization, at the expense of organizing other features that may be noise.
Conclusions

We have developed a 3D fault-directional skeletonization workflow to skeletonize and segment fault images. First, we applied SOF to suppress random and coherent noise. Next, we computed coherence as our edge-detection attribute to detect discontinuous features. Coherence computed after data conditioning using SOF, followed by iterative application of a LoG filter and directional skeletonization rejects noise, enhances faults in the vertical and lateral directions. We skeletonize the results perpendicular to the fault-dip azimuth and dip magnitude, resulting in a sharper, more continuous fault and stratigraphic edges. These discontinuous features can be color coded by their dip azimuth and magnitude or as a suite of independent, azimuthally limited fault sets that may be found to have greater risk of communicating with adjacent aquifers, or on the positive side, to be better correlated with open fractures. Subtle, stratigraphically limited features such as faults within MTCs and syneresis in shales are also enhanced. Multiattribute displays of the skeletonized faults and its dip magnitude and azimuth readily show the interfault relationships. Comparing our directional skeletonization workflow with swarm intelligence, we find that swarm intelligence has the danger of enhancing small artifacts, which are not present in our skeletonization results. Swarm intelligence and directional skeletonization reduce stair-step artifacts, and connect previously discontinuous fault segments. Our skeletonization workflow preserves stratigraphic features, such as dewatering syneresis, which swarm intelligence smears. Cascading directional skeletonization with swarm intelligence results in more continuous and sharper fault imaging than with coherence as the input.

Acknowledgments

We thank the sponsors of the OU Attribute-Assisted Processing and Interpretation Consortium for their guidance and their financial support.

References

AlBinHassan, N. M., and K. J. Marfurt, 2003, Fault detection using Hough transforms: 73rd Annual International Meeting, SEG, Expanded Ab- stracts, 1719–1721.

Bakker, P., L. J. van Vliet, and P. W. Verbeek, 1999, Edge-preserving ori- entation adaptive filtering: Proceedings IEEE-CS Conference on Com- puter Vision and Pattern Recognition, 535–540.

Barnes, A. E., 2006, A filter to improve seismic discontinuity data for fault interpretation: Geophysics, 71, no. 3, P1–P4, doi: 10.1190/1.2195988.

Boe, T. H., 2012, Enhancement of large faults with a windowed 3D Radon transform filter: 82nd Annual International Meeting, SEG, Expanded Ab- stracts, doi: 10.1190/segam2012-1008.1.

Cartwright, J. A., D. James, and A. Bolton, 2003, The genesis of polygonal fault systems: A review, in P. Van Rensbergen, R. R. Hillis, A. J. Maltman, and C. K. Morley, eds., Subsurface sediment mobilization: Geological Society of London, Special Publications, 223–242.

Cohen, I., N. Coult, and A. A. Vassiliou, 2006, Detection and extraction of fault surfaces in 3D seismic data: Geophysics, 71, no. 4, P21–P27, doi: 10.1190/1.2215357.

Davogustto, O., and K. J. Marfurt, 2011, Removing acquisition footprint from legacy data volumes: 81st Annual International Meeting, SEG, Ex- panded Abstracts, 1025–1029.

Dewett, D. T., and A. A. Henza, 2016, Spectral similarity fault enhancement: Interpretation, 4, no. 1, SB149–SB159, doi: 10.1190/INT-2015-0114.1.

Dorn, G. A., B. Kadlec, and P. Murtha, 2012, Imaging faults in 3D seismic volumes: 82nd Annual International Meeting, SEG, Expanded Abstracts, doi: 10.1190/segam2012-1538.1.

Fehmers, G., and C. F. W. Höcher, 2003, Fast structural interpretation with structure-oriented filtering: Geophysics, 68, 1286–1293, doi: 10.1190/1.1598121.

Gersztenkorn, A., and K. J. Marfurt, 1999, Eigenstructure based coherence computations as an aid to 3D structural and stratigraphic mapping: Geo- physics, 64, 1468–1479, doi: 10.1190/1.1444651.

Hale, D., 2013, Methods to compute fault images, extract fault surfaces, and estimate fault throws from 3D seismic images: Geophysics, 78, no. 2, O33–O43, doi: 10.1190/geo2012-0331.1.

Henderson, J., S. J. Purves, and G. Fisher, 2008, Delineation of geological elements from RGB color blending of seismic attributes using a sem- blance-based coherency algorithm: The Leading Edge, 27, 342–350, doi: 10.1190/1.2896625.

Kadlec, B., G. Dorn, H. Tufo, and D. Yuen, 2008, Interactive 3-D compu- tation of fault surfaces using level sets: Visual Geoscience, 13, 133–138, doi: 10.1007/s10069-008-0016-9.

Li, F., and W. Lu, 2014, Coherence attribute at different spectral scales: In- terpretation, 2, no. 1, SA99–SA106, doi: 10.1190/INT-2013-0089.1.

Luo, Y., 2002, Edge-preserving smoothing and applications: The Leading Edge, 21, 136–158, doi: 10.1190/1.1452603.

Luo, Y., W. G. Higgs, and W. S. Kowalik, 1996, Edge detection and strati- graphic analysis using 3D seismic data: 66th Annual International Meet- ing, SEG, Expanded Abstracts, 324–327.

Machado, G., A. Alali, B. Hutchinson, O. Olorunsola, and K. J. Marfurt, 2016, Display and enhancement of volumetric fault image: Interpretation, 4, no. 1, SB51–SB61, doi: 10.1190/INT-2015-0104.1.

Marfurt, K. J., 2006, Robust estimates of 3D reflector dip and azimuth: Geo- physics, 71, no. 4, P29–P40, doi: 10.1190/1.2213049.

Marfurt, K. J., 2015, Techniques and best practices in multiattribute display: Interpretation, 3, no. 1, B1–B23, doi: 10.1190/INT-2014-0133.1.

Marfurt, K. J., R. L. Kirlin, S. H. Farmer, and M. S. Bahorich, 1998, 3D seismic attributes using a running window semblance-based algorithm: Geophysics, 63, 1150–1165, doi: 10.1190/1.1444415.

Pedersen, S., T. Randen, L. Sonneland, and O. Steen, 2002, Automatic 3D fault interpretation by artificial ants: 72nd Annual International Meeting, SEG, Expanded Abstracts, 512–515.

Qi, J., F. Li, B. Lyu, O. Olorunsola, K. J. Marfurt, and B. Zhang, 2016, Seismic fault enhancement and skeletonization: 86th Annual International Meeting, SEG, Expanded Abstracts, 1966–1970.

Qi, J., T. Lin, T. Zhao, F. Li, and K. J. Marfurt, 2016, Semisupervised multi- attribute seismic facies analysis: Interpretation, 4, no. 1, SB91–SB106, doi: 10.1190/INT-2015-0098.1.

Qi, J., B. Zhang, H. Zhou, and K. J. Marfurt, 2014, Attribute expression of fault-controlled karst — Fort Worth Basin, TX: Interpretation, 2, no. 3, SF91–SF110, doi: 10.1190/INT-2013-0188.1.

Randen, T., S. Pedersen, and L. Sønneland, 2001, Automatic extraction of fault surfaces from three-dimensional seismic data: 71st Annual International Meeting, SEG, Expanded Abstracts, 551–554.

Wallet, B., V. Aarre, A. Davids, T. Dao, and K. J. Marfurt, 2011, Using a hue-saturation color map to visualize dewatering faults in the overburden of the Hod Field, North Sea: 81st Annual International Meeting, SEG, Expanded Abstracts, 946–950.

Wang, X., J. Gao, C. Chen, C. Yang, and Z. Zhu, 2016, Detecting method of seismic discontinuities based on high dimensional continuous wavelet transform (in Chinese): Chinese Journal of Geophysics, 29, 3394–3407.

Wu, X., and D. Hale, 2015, 3D seismic image processing for faults: Geo-physics, 81,   no.   2,   IM1–IM11,   doi:   10.1190/geo2015-0380.1.

Wu, X., and D. Hale, 2016, Automatically interpreting all faults, unconformities, and horizons from 3D seismic images: Interpretation, 4, no. 2, T227– T237, doi: 10.1190/INT-2015-0160.1.

Zhang, B., D. Chang, T. Lin, and K. J. Marfurt, 2015, Improving the quality of prestack inversion by prestack data conditioning: Interpretation, 3, no. 1, T5–T12, doi: 10.1190/INT-2014-0124.1.

Zhang, B., Y. Liu, M. Pelissier, and N. Hemstra, 2014, Semiautomated fault interpretation based on seismic attributes: Interpretation, 2, no. 1, SA11– SA19, doi: 10.1190/INT-2013-0060.1.

Welcome Back!

Download PDF here

OR

Request access by filling the form below to download full PDF.
Name(Required)
Most Popular Papers
Case Study: An Integrated Machine Learning-Based Fault Classification Workflow
Using machine learning to classify a 100-square-mile seismic volume in the Niobrara, geoscientists were able to interpret thin beds below ...
Case Study with Petrobras: Applying Unsupervised Multi-Attribute Machine Learning for 3D Stratigraphic Facies Classification in a Carbonate Field, Offshore Brazil
Using machine learning to classify a 100-square-mile seismic volume in the Niobrara, geoscientists were able to interpret thin beds below ...
Applying Machine Learning Technologies in the Niobrara Formation, DJ Basin, to Quickly Produce an Integrated Structural and Stratigraphic Seismic Classification Volume Calibrated to Wells
Carolan Laudon, Jie Qi, Yin-Kai Wang, Geophysical Research, LLC (d/b/a Geophysical Insights), University of Houston | Published with permission: Unconventional Resources ...
Shopping Cart
  • Registration confirmation will be emailed to you.

  • We're committed to your privacy. Geophysical Insights uses the information you provide to us to contact you about our relevant content, events, and products. You may unsubscribe from these communications at any time. For more information, check out our Privacy Policy

    Deborah SacreyOwner - Auburn Energy

    How to Use Paradise to Interpret Carbonate Reservoirs

    The key to understanding Carbonate reservoirs in Paradise start with good synthetic ties to the wavelet data. If one is not tied correctly, then it will be very east to mis-interpret the neurons as reservoir, when they are not. Secondly, the workflow should utilize Principal Component Analysis to better understand the zone of interest and the attributes to use in the SOM analysis. An important part to interpretation is understanding “Halo” and “Trailing” neurons as part of the stack around a reservoir or potential reservoir. Usually, one sees this phenomenon around deep, pressured gas reservoirs, but it can happen in shallow reservoirs as well. Two case studies are presented to emphasize the importance of looking for halo or trailing patterns around good reservoirs. One is a deep Edwards example in south central Texas, and the other a shallow oil reservoir in the Austin Chalk in the San Antonio area. Another way to help enhance carbonate reservoirs is through Spectral Decomposition. A case history is shown in the Smackover in Alabama to highlight and focus on an oolitic shoal reservoir which tunes at a specific frequency in the best wells. Not all carbonate porosity is at the top of the deposition. A case history will be discussed looking for porosity in the center portion of a reef in west Texas. And finally, one of the most difficult interpretation challenges in the carbonate spectrum is correctly mapping the interface between two carbonate layers. A simple technique is shown to help with that dilemma, by using few attributes and a low-topology count to understand regional depositional sequences. This example is from the Delaware Basin in southeastern New Mexico.

    Dr. Carrie LaudonSenior Geophysical Consultant

    Applying Unsupervised Multi-Attribute Machine Learning for 3D Stratigraphic Facies Classification in a Carbonate Field, Offshore Brazil

    We present results of a multi-attribute, machine learning study over a pre-salt carbonate field in the Santos Basin, offshore Brazil. These results test the accuracy and potential of Self-organizing maps (SOM) for stratigraphic facies delineation. The study area has an existing detailed geological facies model containing predominantly reef facies in an elongated structure.

    Carrie LaudonSenior Geophysical Consultant - Geophysical Insights

    Automatic Fault Detection and Applying Machine Learning to Detect Thin Beds

    Rapid advances in Machine Learning (ML) are transforming seismic analysis. Using these new tools, geoscientists can accomplish the following quickly and effectively:

    • Run fault detection analysis in a few hours, not weeks
    • Identify thin beds down to a single seismic sample
    • Generate seismic volumes that capture structural and stratigraphic details

    Join us for a ‘Lunch & Learn’ sessions daily at 11:00 where Dr. Carolan (“Carrie”) Laudon will review the theory and results of applying a combination of machine learning tools to obtain the above results.  A detailed agenda follows.

    Agenda

    Automated Fault Detection using 3D CNN Deep Learning

    • Deep learning fault detection
    • Synthetic models
    • Fault image enhancement
    • Semi-supervised learning for visualization
    • Application results
      • Normal faults
      • Fault/fracture trends in complex reservoirs

    Demo of Paradise Fault Detection Thoughtflow®

    Stratigraphic analysis using machine learning with fault detection

    • Attribute Selection using Principal Component Analysis (PCA)
    • Multi-Attribute Classification using Self-Organizing Maps (SOM)
    • Case studies – stratigraphic analysis and fault detection
      • Fault-karst and fracture examples, China
      • Niobrara – Stratigraphic analysis and thin beds, faults
    Thomas ChaparroSenior Geophysicist - Geophysical Insights

    Paradise: A Day in The Life of the Geoscientist

    Over the last several years, the industry has invested heavily in Machine Learning (ML) for better predictions and automation. Dramatic results have been realized in exploration, field development, and production optimization. However, many of these applications have been single use ‘point’ solutions. There is a growing body of evidence that seismic analysis is best served using a combination of ML tools for a specific objective, referred to as ML Orchestration. This talk demonstrates how the Paradise AI workbench applications are used in an integrated workflow to achieve superior results than traditional interpretation methods or single-purpose ML products. Using examples from combining ML-based Fault Detection and Stratigraphic Analysis, the talk will show how ML orchestration produces value for exploration and field development by the interpreter leveraging ML orchestration.

    Aldrin RondonSenior Geophysical Engineer - Dragon Oil

    Machine Learning Fault Detection: A Case Study

    An innovative Fault Pattern Detection Methodology has been carried out using a combination of Machine Learning Techniques to produce a seismic volume suitable for fault interpretation in a structurally and stratigraphic complex field. Through theory and results, the main objective was to demonstrate that a combination of ML tools can generate superior results in comparison with traditional attribute extraction and data manipulation through conventional algorithms. The ML technologies applied are a supervised, deep learning, fault classification followed by an unsupervised, multi-attribute classification combining fault probability and instantaneous attributes.

    Thomas ChaparroSenior Geophysicist - Geophysical Insights

    Thomas Chaparro is a Senior Geophysicist who specializes in training and preparing AI-based workflows. Thomas also has experience as a processing geophysicist and 2D and 3D seismic data processing. He has participated in projects in the Gulf of Mexico, offshore Africa, the North Sea, Australia, Alaska, and Brazil.

    Thomas holds a bachelor’s degree in Geology from Northern Arizona University and a Master’s in Geophysics from the University of California, San Diego. His research focus was computational geophysics and seismic anisotropy.

    Aldrin RondonSenior Geophysical Engineer - Dragon Oil

    Bachelor’s Degree in Geophysical Engineering from Central University in Venezuela with a specialization in Reservoir Characterization from Simon Bolivar University.

    Over 20 years exploration and development geophysical experience with extensive 2D and 3D seismic interpretation including acquisition and processing.

    Aldrin spent his formative years working on exploration activity in PDVSA Venezuela followed by a period working for a major international consultant company in the Gulf of Mexico (Landmark, Halliburton) as a G&G consultant. Latterly he was working at Helix in Scotland, UK on producing assets in the Central and South North Sea.  From 2007 to 2021, he has been working as a Senior Seismic Interpreter in Dubai involved in different dedicated development projects in the Caspian Sea.

    Deborah SacreyOwner - Auburn Energy

    How to Use Paradise to Interpret Clastic Reservoirs

    The key to understanding Clastic reservoirs in Paradise starts with good synthetic ties to the wavelet data. If one is not tied correctly, then it will be easy to mis-interpret the neurons as reservoir, whin they are not. Secondly, the workflow should utilize Principal Component Analysis to better understand the zone of interest and the attributes to use in the SOM analysis. An important part to interpretation is understanding “Halo” and “Trailing” neurons as part of the stack around a reservoir or potential reservoir. Deep, high-pressured reservoirs often “leak” or have vertical percolation into the seal. This changes the rock properties enough in the seal to create a “halo” effect in SOM. Likewise, the frequency changes of the seismic can cause a subtle “dim-out”, not necessarily observable in the wavelet data, but enough to create a different pattern in the Earth in terms of these rock property changes. Case histories for Halo and trailing neural information include deep, pressured, Chris R reservoir in Southern Louisiana, Frio pay in Southeast Texas and AVO properties in the Yegua of Wharton County. Additional case histories to highlight interpretation include thin-bed pays in Brazoria County, including updated information using CNN fault skeletonization. Continuing the process of interpretation is showing a case history in Wharton County on using Low Probability to help explore Wilcox reservoirs. Lastly, a look at using Paradise to help find sweet spots in unconventional reservoirs like the Eagle Ford, a case study provided by Patricia Santigrossi.

    Mike DunnSr. Vice President of Business Development

    Machine Learning in the Cloud

    Machine Learning in the Cloud will address the capabilities of the Paradise AI Workbench, featuring on-demand access enabled by the flexible hardware and storage facilities available on Amazon Web Services (AWS) and other commercial cloud services. Like the on-premise instance, Paradise On-Demand provides guided workflows to address many geologic challenges and investigations. The presentation will show how geoscientists can accomplish the following workflows quickly and effectively using guided ThoughtFlows® in Paradise:

    • Identify and calibrate detailed stratigraphy using seismic and well logs
    • Classify seismic facies
    • Detect faults automatically
    • Distinguish thin beds below conventional tuning
    • Interpret Direct Hydrocarbon Indicators
    • Estimate reserves/resources

    Attend the talk to see how ML applications are combined through a process called "Machine Learning Orchestration," proven to extract more from seismic and well data than traditional means.

    Sarah Stanley
    Senior Geoscientist

    Stratton Field Case Study – New Solutions to Old Problems

    The Oligocene Frio gas-producing Stratton Field in south Texas is a well-known field. Like many onshore fields, the productive sand channels are difficult to identify using conventional seismic data. However, the productive channels can be easily defined by employing several Paradise modules, including unsupervised machine learning, Principal Component Analysis, Self-Organizing Maps, 3D visualization, and the new Well Log Cross Section and Well Log Crossplot tools. The Well Log Cross Section tool generates extracted seismic data, including SOMs, along the Cross Section boreholes and logs. This extraction process enables the interpreter to accurately identify the SOM neurons associated with pay versus neurons associated with non-pay intervals. The reservoir neurons can be visualized throughout the field in the Paradise 3D Viewer, with Geobodies generated from the neurons. With this ThoughtFlow®, pay intervals previously difficult to see in conventional seismic can finally be visualized and tied back to the well data.

    Laura Cuttill
    Practice Lead, Advertas

    Young Professionals – Managing Your Personal Brand to Level-up Your Career

    No matter where you are in your career, your online “personal brand” has a huge impact on providing opportunity for prospective jobs and garnering the respect and visibility needed for advancement. While geoscientists tackle ambitious projects, publish in technical papers, and work hard to advance their careers, often, the value of these isn’t realized beyond their immediate professional circle. Learn how to…

    • - Communicate who you are to high-level executives in exploration and development
    • - Avoid common social media pitfalls
    • - Optimize your online presence to best garner attention from recruiters
    • - Stay relevant
    • - Create content of interest
    • - Establish yourself as a thought leader in your given area of specialization
    Laura Cuttill
    Practice Lead, Advertas

    As a 20-year marketing veteran marketing in oil and gas and serial entrepreneur, Laura has deep experience in bringing technology products to market and growing sales pipeline. Armed with a marketing degree from Texas A&M, she began her career doing technical writing for Schlumberger and ExxonMobil in 2001. She started Advertas as a co-founder in 2004 and began to leverage her upstream experience in marketing. In 2006, she co-founded the cyber-security software company, 2FA Technology. After growing 2FA from a startup to 75% market share in target industries, and the subsequent sale of the company, she returned to Advertas to continue working toward the success of her clients, such as Geophysical Insights. Today, she guides strategy for large-scale marketing programs, manages project execution, cultivates relationships with industry media, and advocates for data-driven, account-based marketing practices.

    Fabian Rada
    Sr. Geophysicist, Petroleum Oil & Gas Services

    Statistical Calibration of SOM results with Well Log Data (Case Study)

    The first stage of the proposed statistical method has proven to be very useful in testing whether or not there is a relationship between two qualitative variables (nominal or ordinal) or categorical quantitative variables, in the fields of health and social sciences. Its application in the oil industry allows geoscientists not only to test dependence between discrete variables, but to measure their degree of correlation (weak, moderate or strong). This article shows its application to reveal the relationship between a SOM classification volume of a set of nine seismic attributes (whose vertical sampling interval is three meters) and different well data (sedimentary facies, Net Reservoir, and effective porosity grouped by ranges). The data were prepared to construct the contingency tables, where the dependent (response) variable and independent (explanatory) variable were defined, the observed frequencies were obtained, and the frequencies that would be expected if the variables were independent were calculated and then the difference between the two magnitudes was studied using the contrast statistic called Chi-Square. The second stage implies the calibration of the SOM volume extracted along the wellbore path through statistical analysis of the petrophysical properties VCL and PHIE, and SW for each neuron, which allowed to identify the neurons with the best petrophysical values in a carbonate reservoir.

    Heather Bedle
    Assistant Professor, University of Oklahoma

    Heather Bedle received a B.S. (1999) in physics from Wake Forest University, and then worked as a systems engineer in the defense industry. She later received a M.S. (2005) and a Ph. D. (2008) degree from Northwestern University. After graduate school, she joined Chevron and worked as both a development geologist and geophysicist in the Gulf of Mexico before joining Chevron’s Energy Technology Company Unit in Houston, TX. In this position, she worked with the Rock Physics from Seismic team analyzing global assets in Chevron’s portfolio. Dr. Bedle is currently an assistant professor of applied geophysics at the University of Oklahoma’s School of Geosciences. She joined OU in 2018, after instructing at the University of Houston for two years. Dr. Bedle and her student research team at OU primarily work with seismic reflection data, using advanced techniques such as machine learning, attribute analysis, and rock physics to reveal additional structural, stratigraphic and tectonic insights of the subsurface.

    Jie Qi
    Research Geophysicist

    An Integrated Fault Detection Workflow

    Seismic fault detection is one of the top critical procedures in seismic interpretation. Identifying faults are significant for characterizing and finding the potential oil and gas reservoirs. Seismic amplitude data exhibiting good resolution and a high signal-to-noise ratio are key to identifying structural discontinuities using seismic attributes or machine learning techniques, which in turn serve as input for automatic fault extraction. Deep learning Convolutional Neural Networks (CNN) performs well on fault detection without any human-computer interactive work. This study shows an integrated CNN-based fault detection workflow to construct fault images that are sufficiently smooth for subsequent fault automatic extraction. The objectives were to suppress noise or stratigraphic anomalies subparallel to reflector dip, and sharpen fault and other discontinuities that cut reflectors, preconditioning the fault images for subsequent automatic extraction. A 2D continuous wavelet transform-based acquisition footprint suppression method was applied time slice by time slice to suppress wavenumber components to avoid interpreting the acquisition footprint as artifacts by the CNN fault detection method. To further suppress cross-cutting noise as well as sharpen fault edges, a principal component edge-preserving structure-oriented filter is also applied. The conditioned amplitude volume is then fed to a pre-trained CNN model to compute fault probability. Finally, a Laplacian of Gaussian filter is applied to the original CNN fault probability to enhance fault images. The resulting fault probability volume is favorable with respect to traditional human-interpreter generated on vertical slices through the seismic amplitude volume.

    Dr. Jie Qi
    Research Geophysicist

    An integrated machine learning-based fault classification workflow

    We introduce an integrated machine learning-based fault classification workflow that creates fault component classification volumes that greatly reduces the burden on the human interpreter. We first compute a 3D fault probability volume from pre-conditioned seismic amplitude data using a 3D convolutional neural network (CNN). However, the resulting “fault probability” volume delineates other non-fault edges such as angular unconformities, the base of mass transport complexes, and noise such as acquisition footprint. We find that image processing-based fault discontinuity enhancement and skeletonization methods can enhance the fault discontinuities and suppress many of the non-fault discontinuities. Although each fault is characterized by its dip and azimuth, these two properties are discontinuous at azimuths of φ=±180° and for near vertical faults for azimuths φ and φ+180° requiring them to be parameterized as four continuous geodetic fault components. These four fault components as well as the fault probability can then be fed into a self-organizing map (SOM) to generate fault component classification. We find that the final classification result can segment fault sets trending in interpreter-defined orientations and minimize the impact of stratigraphy and noise by selecting different neurons from the SOM 2D neuron color map.

    Ivan Marroquin
    Senior Research Geophysicist

    Connecting Multi-attribute Classification to Reservoir Properties

    Interpreters rely on seismic pattern changes to identify and map geologic features of importance. The ability to recognize such features depends on the seismic resolution and characteristics of seismic waveforms. With the advancement of machine learning algorithms, new methods for interpreting seismic data are being developed. Among these algorithms, self-organizing maps (SOM) provides a different approach to extract geological information from a set of seismic attributes.

    SOM approximates the input patterns by a finite set of processing neurons arranged in a regular 2D grid of map nodes. Such that, it classifies multi-attribute seismic samples into natural clusters following an unsupervised approach. Since machine learning is unbiased, so the classifications can contain both geological information and coherent noise. Thus, seismic interpretation evolves into broader geologic perspectives. Additionally, SOM partitions multi-attribute samples without a priori information to guide the process (e.g., well data).

    The SOM output is a new seismic attribute volume, in which geologic information is captured from the classification into winning neurons. Implicit and useful geological information are uncovered through an interactive visual inspection of winning neuron classifications. By doing so, interpreters build a classification model that aids them to gain insight into complex relationships between attribute patterns and geological features.

    Despite all these benefits, there are interpretation challenges regarding whether there is an association between winning neurons and geological features. To address these issues, a bivariate statistical approach is proposed. To evaluate this analysis, three cases scenarios are presented. In each case, the association between winning neurons and net reservoir (determined from petrophysical or well log properties) at well locations is analyzed. The results show that the statistical analysis not only aid in the identification of classification patterns; but more importantly, reservoir/not reservoir classification by classical petrophysical analysis strongly correlates with selected SOM winning neurons. Confidence in interpreted classification features is gained at the borehole and interpretation is readily extended as geobodies away from the well.

    Heather Bedle
    Assistant Professor, University of Oklahoma

    Gas Hydrates, Reefs, Channel Architecture, and Fizz Gas: SOM Applications in a Variety of Geologic Settings

    Students at the University of Oklahoma have been exploring the uses of SOM techniques for the last year. This presentation will review learnings and results from a few of these research projects. Two projects have investigated the ability of SOMs to aid in identification of pore space materials – both trying to qualitatively identify gas hydrates and under-saturated gas reservoirs. A third study investigated individual attributes and SOMs in recognizing various carbonate facies in a pinnacle reef in the Michigan Basin. The fourth study took a deep dive of various machine learning algorithms, of which SOMs will be discussed, to understand how much machine learning can aid in the identification of deepwater channel architectures.

    Fabian Rada
    Sr. Geophysicist, Petroleum Oil & Gas Servicest

    Fabian Rada joined Petroleum Oil and Gas Services, Inc (POGS) in January 2015 as Business Development Manager and Consultant to PEMEX. In Mexico, he has participated in several integrated oil and gas reservoir studies. He has consulted with PEMEX Activos and the G&G Technology group to apply the Paradise AI workbench and other tools. Since January 2015, he has been working with Geophysical Insights staff to provide and implement the multi-attribute analysis software Paradise in Petróleos Mexicanos (PEMEX), running a successful pilot test in Litoral Tabasco Tsimin Xux Asset. Mr. Rada began his career in the Venezuelan National Foundation for Seismological Research, where he participated in several geophysical projects, including seismic and gravity data for micro zonation surveys. He then joined China National Petroleum Corporation (CNPC) as QC Geophysicist until he became the Chief Geophysicist in the QA/QC Department. Then, he transitioned to a subsidiary of Petróleos de Venezuela (PDVSA), as a member of the QA/QC and Chief of Potential Field Methods section. Mr. Rada has also participated in processing land seismic data and marine seismic/gravity acquisition surveys. Mr. Rada earned a B.S. in Geophysics from the Central University of Venezuela.

    Hal GreenDirector, Marketing & Business Development - Geophysical Insights

    Introduction to Automatic Fault Detection and Applying Machine Learning to Detect Thin Beds

    Rapid advances in Machine Learning (ML) are transforming seismic analysis. Using these new tools, geoscientists can accomplish the following quickly and effectively: a combination of machine learning (ML) and deep learning applications, geoscientists apply Paradise to extract greater insights from seismic and well data for these and other objectives:

    • Run fault detection analysis in a few hours, not weeks
    • Identify thin beds down to a single seismic sample
    • Overlay fault images on stratigraphic analysis

    The brief introduction will orient you with the technology and examples of how machine learning is being applied to automate interpretation while generating new insights in the data.

    Sarah Stanley
    Senior Geoscientist and Lead Trainer

    Sarah Stanley joined Geophysical Insights in October, 2017 as a geoscience consultant, and became a full-time employee July 2018. Prior to Geophysical Insights, Sarah was employed by IHS Markit in various leadership positions from 2011 to her retirement in August 2017, including Director US Operations Training and Certification, the Operational Governance Team, and, prior to February 2013, Director of IHS Kingdom Training. Sarah joined SMT in May, 2002, and was the Director of Training for SMT until IHS Markit’s acquisition in 2011.

    Prior to joining SMT Sarah was employed by GeoQuest, a subdivision of Schlumberger, from 1998 to 2002. Sarah was also Director of the Geoscience Technology Training Center, North Harris College from 1995 to 1998, and served as a voluntary advisor on geoscience training centers to various geological societies. Sarah has over 37 years of industry experience and has worked as a petroleum geoscientist in various domestic and international plays since August of 1981. Her interpretation experience includes tight gas sands, coalbed methane, international exploration, and unconventional resources.

    Sarah holds a Bachelor’s of Science degree with majors in Biology and General Science and minor in Earth Science, a Master’s of Arts in Education and Master’s of Science in Geology from Ball State University, Muncie, Indiana. Sarah is both a Certified Petroleum Geologist, and a Registered Geologist with the State of Texas. Sarah holds teaching credentials in both Indiana and Texas.

    Sarah is a member of the Houston Geological Society and the American Association of Petroleum Geologists, where she currently serves in the AAPG House of Delegates. Sarah is a recipient of the AAPG Special Award, the AAPG House of Delegates Long Service Award, and the HGS President’s award for her work in advancing training for petroleum geoscientists. She has served on the AAPG Continuing Education Committee and was Chairman of the AAPG Technical Training Center Committee. Sarah has also served as Secretary of the HGS, and Served two years as Editor for the AAPG Division of Professional Affairs Correlator.

    Dr. Tom Smith
    President & CEO

    Dr. Tom Smith received a BS and MS degree in Geology from Iowa State University. His graduate research focused on a shallow refraction investigation of the Manson astrobleme. In 1971, he joined Chevron Geophysical as a processing geophysicist but resigned in 1980 to complete his doctoral studies in 3D modeling and migration at the Seismic Acoustics Lab at the University of Houston. Upon graduation with the Ph.D. in Geophysics in 1981, he started a geophysical consulting practice and taught seminars in seismic interpretation, seismic acquisition and seismic processing. Dr. Smith founded Seismic Micro-Technology in 1984 to develop PC software to support training workshops which subsequently led to development of the KINGDOM Software Suite for integrated geoscience interpretation with world-wide success.

    The Society of Exploration Geologists (SEG) recognized Dr. Smith’s work with the SEG Enterprise Award in 2000, and in 2010, the Geophysical Society of Houston (GSH) awarded him an Honorary Membership. Iowa State University (ISU) has recognized Dr. Smith throughout his career with the Distinguished Alumnus Lecturer Award in 1996, the Citation of Merit for National and International Recognition in 2002, and the highest alumni honor in 2015, the Distinguished Alumni Award. The University of Houston College of Natural Sciences and Mathematics recognized Dr. Smith with the 2017 Distinguished Alumni Award.

    In 2009, Dr. Smith founded Geophysical Insights, where he leads a team of geophysicists, geologists and computer scientists in developing advanced technologies for fundamental geophysical problems. The company launched the Paradise® multi-attribute analysis software in 2013, which uses Machine Learning and pattern recognition to extract greater information from seismic data.

    Dr. Smith has been a member of the SEG since 1967 and is a professional member of SEG, GSH, HGS, EAGE, SIPES, AAPG, Sigma XI, SSA and AGU. Dr. Smith served as Chairman of the SEG Foundation from 2010 to 2013. On January 25, 2016, he was recognized by the Houston Geological Society (HGS) as a geophysicist who has made significant contributions to the field of geology. He currently serves on the SEG President-Elect’s Strategy and Planning Committee and the ISU Foundation Campaign Committee for Forever True, For Iowa State.

    Carrie LaudonSenior Geophysical Consultant - Geophysical Insights

    Applying Machine Learning Technologies in the Niobrara Formation, DJ Basin, to Quickly Produce an Integrated Structural and Stratigraphic Seismic Classification Volume Calibrated to Wells

    This study will demonstrate an automated machine learning approach for fault detection in a 3D seismic volume. The result combines Deep Learning Convolution Neural Networks (CNN) with a conventional data pre-processing step and an image processing-based post processing approach to produce high quality fault attribute volumes of fault probability, fault dip magnitude and fault dip azimuth. These volumes are then combined with instantaneous attributes in an unsupervised machine learning classification, allowing the isolation of both structural and stratigraphic features into a single 3D volume. The workflow is illustrated on a 3D seismic volume from the Denver Julesburg Basin and a statistical analysis is used to calibrate results to well data.

    Ivan Marroquin
    Senior Research Geophysicist

    Iván Dimitri Marroquín is a 20-year veteran of data science research, consistently publishing in peer-reviewed journals and speaking at international conference meetings. Dr. Marroquín received a Ph.D. in geophysics from McGill University, where he conducted and participated in 3D seismic research projects. These projects focused on the development of interpretation techniques based on seismic attributes and seismic trace shape information to identify significant geological features or reservoir physical properties. Examples of his research work are attribute-based modeling to predict coalbed thickness and permeability zones, combining spectral analysis with coherency imagery technique to enhance interpretation of subtle geologic features, and implementing a visual-based data mining technique on clustering to match seismic trace shape variability to changes in reservoir properties.

    Dr. Marroquín has also conducted some ground-breaking research on seismic facies classification and volume visualization. This lead to his development of a visual-based framework that determines the optimal number of seismic facies to best reveal meaningful geologic trends in the seismic data. He proposed seismic facies classification as an alternative to data integration analysis to capture geologic information in the form of seismic facies groups. He has investigated the usefulness of mobile devices to locate, isolate, and understand the spatial relationships of important geologic features in a context-rich 3D environment. In this work, he demonstrated mobile devices are capable of performing seismic volume visualization, facilitating the interpretation of imaged geologic features.  He has definitively shown that mobile devices eventually will allow the visual examination of seismic data anywhere and at any time.

    In 2016, Dr. Marroquín joined Geophysical Insights as a senior researcher, where his efforts have been focused on developing machine learning solutions for the oil and gas industry. For his first project, he developed a novel procedure for lithofacies classification that combines a neural network with automated machine methods. In parallel, he implemented a machine learning pipeline to derive cluster centers from a trained neural network. The next step in the project is to correlate lithofacies classification to the outcome of seismic facies analysis.  Other research interests include the application of diverse machine learning technologies for analyzing and discerning trends and patterns in data related to oil and gas industry.

    Dr. Jie Qi
    Research Geophysicist

    Dr. Jie Qi is a Research Geophysicist at Geophysical Insights, where he works closely with product development and geoscience consultants. His research interests include machine learning-based fault detection, seismic interpretation, pattern recognition, image processing, seismic attribute development and interpretation, and seismic facies analysis. Dr. Qi received a BS (2011) in Geoscience from the China University of Petroleum in Beijing, and an MS (2013) in Geophysics from the University of Houston. He earned a Ph.D. (2017) in Geophysics from the University of Oklahoma, Norman. His industry experience includes work as a Research Assistant (2011-2013) at the University of Houston and the University of Oklahoma (2013-2017). Dr. Qi was with Petroleum Geo-Services (PGS), Inc. in 2014 as a summer intern, where he worked on a semi-supervised seismic facies analysis. In 2017, he served as a postdoctoral Research Associate in the Attributed Assisted-Seismic Processing and Interpretation (AASPI) consortium at the University of Oklahoma from 2017 to 2020.

    Rocky R. Roden
    Senior Consulting Geophysicist

    The Relationship of Self-Organization, Geology, and Machine Learning

    Self-organization is the nonlinear formation of spatial and temporal structures, patterns or functions in complex systems (Aschwanden et al., 2018). Simple examples of self-organization include flocks of birds, schools of fish, crystal development, formation of snowflakes, and fractals. What these examples have in common is the appearance of structure or patterns without centralized control. Self-organizing systems are typically governed by power laws, such as the Gutenberg-Richter law of earthquake frequency and magnitude. In addition, the time frames of such systems display a characteristic self-similar (fractal) response, where earthquakes or avalanches for example, occur over all possible time scales (Baas, 2002).

    The existence of nonlinear dynamic systems and ordered structures in the earth are well known and have been studied for centuries and can appear as sedimentary features, layered and folded structures, stratigraphic formations, diapirs, eolian dune systems, channelized fluvial and deltaic systems, and many more (Budd, et al., 2014; Dietrich and Jacob, 2018). Each of these geologic processes and features exhibit patterns through the action of undirected local dynamics and is generally termed “self-organization” (Paola, 2014).

    Artificial intelligence and specifically neural networks exhibit and reveal self-organization characteristics. The reason for the interest in applying neural networks stems from the fact that they are universal approximators for various kinds of nonlinear dynamical systems of arbitrary complexity (Pessa, 2008). A special class of artificial neural networks is aptly named self-organizing map (SOM) (Kohonen, 1982). It has been found that SOM can identify significant organizational structure in the form of clusters from seismic attributes that relate to geologic features (Strecker and Uden, 2002; Coleou et al., 2003; de Matos, 2006; Roy et al., 2013; Roden et al., 2015; Zhao et al., 2016; Roden et al., 2017; Zhao et al., 2017; Roden and Chen, 2017; Sacrey and Roden, 2018; Leal et al, 2019; Hussein et al., 2020; Hardage et al., 2020; Manauchehri et al., 2020). As a consequence, SOM is an excellent machine learning neural network approach utilizing seismic attributes to help identify self-organization features and define natural geologic patterns not easily seen or seen at all in the data.

    Rocky R. Roden
    Senior Consulting Geophysicist

    Rocky R. Roden started his own consulting company, Rocky Ridge Resources Inc. in 2003 and works with several oil companies on technical and prospect evaluation issues. He is also a principal in the Rose and Associates DHI Risk Analysis Consortium and was Chief Consulting Geophysicist with Seismic Micro-technology. Rocky is a proven oil finder with 37 years in the industry, gaining extensive knowledge of modern geoscience technical approaches.

    Rocky holds a BS in Oceanographic Technology-Geology from Lamar University and a MS in Geological and Geophysical Oceanography from Texas A&M University. As Chief Geophysicist and Director of Applied Technology for Repsol-YPF, his role comprised of advising corporate officers, geoscientists, and managers on interpretation, strategy and technical analysis for exploration and development in offices in the U.S., Argentina, Spain, Egypt, Bolivia, Ecuador, Peru, Brazil, Venezuela, Malaysia, and Indonesia. He has been involved in the technical and economic evaluation of Gulf of Mexico lease sales, farmouts worldwide, and bid rounds in South America, Europe, and the Far East. Previous work experience includes exploration and development at Maxus Energy, Pogo Producing, Decca Survey, and Texaco. Rocky is a member of SEG, AAPG, HGS, GSH, EAGE, and SIPES; he is also a past Chairman of The Leading Edge Editorial Board.

    Bob A. Hardage

    Bob A. Hardage received a PhD in physics from Oklahoma State University. His thesis work focused on high-velocity micro-meteoroid impact on space vehicles, which required trips to Goddard Space Flight Center to do finite-difference modeling on dedicated computers. Upon completing his university studies, he worked at Phillips Petroleum Company for 23 years and was Exploration Manager for Asia and Latin America when he left Phillips. He moved to WesternAtlas and worked 3 years as Vice President of Geophysical Development and Marketing. He then established a multicomponent seismic research laboratory at the Bureau of Economic Geology and served The University of Texas at Austin as a Senior Research Scientist for 28 years. He has published books on VSP, cross-well profiling, seismic stratigraphy, and multicomponent seismic technology. He was the first person to serve 6 years on the Board of Directors of the Society of Exploration Geophysicists (SEG). His Board service was as SEG Editor (2 years), followed by 1-year terms as First VP, President Elect, President, and Past President. SEG has awarded him a Special Commendation, Life Membership, and Honorary Membership. He wrote the AAPG Explorer column on geophysics for 6 years. AAPG honored him with a Distinguished Service award for promoting geophysics among the geological community.

    Bob A. Hardage

    Investigating the Internal Fabric of VSP data with Attribute Analysis and Unsupervised Machine Learning

    Examination of vertical seismic profile (VSP) data with unsupervised machine learning technology is a rigorous way to compare the fabric of down-going, illuminating, P and S wavefields with the fabric of up-going reflections and interbed multiples created by these wavefields. This concept is introduced in this paper by applying unsupervised learning to VSP data to better understand the physics of P and S reflection seismology. The zero-offset VSP data used in this investigation were acquired in a hard-rock, fast-velocity, environment that caused the shallowest 2 or 3 geophones to be inside the near-field radiation zone of a vertical-vibrator baseplate. This study shows how to use instantaneous attributes to backtrack down-going direct-P and direct-S illuminating wavelets to the vibrator baseplate inside the near-field zone. This backtracking confirms that the points-of-origin of direct-P and direct-S are identical. The investigation then applies principal component (PCA) analysis to VSP data and shows that direct-S and direct-P wavefields that are created simultaneously at a vertical-vibrator baseplate have the same dominant principal components. A self-organizing map (SOM) approach is then taken to illustrate how unsupervised machine learning describes the fabric of down-going and up-going events embedded in vertical-geophone VSP data. These SOM results show that a small number of specific neurons build the down-going direct-P illuminating wavefield, and another small group of neurons build up-going P primary reflections and early-arriving down-going P multiples. The internal attribute fabric of these key down-going and up-going neurons are then compared to expose their similarities and differences. This initial study indicates that unsupervised machine learning, when applied to VSP data, is a powerful tool for understanding the physics of seismic reflectivity at a prospect. This research strategy of analyzing VSP data with unsupervised machine learning will now expand to horizontal-geophone VSP data.

    Tom Smith
    President and CEO, Geophysical Insights

    Machine Learning for Incomplete Geoscientists

    This presentation covers big-picture machine learning buzz words with humor and unassailable frankness. The goal of the material is for every geoscientist to gain confidence in these important concepts and how they add to our well-established practices, particularly seismic interpretation. Presentation topics include a machine learning historical perspective, what makes it different, a fish factory, Shazam, comparison of supervised and unsupervised machine learning methods with examples, tuning thickness, deep learning, hard/soft attribute spaces, multi-attribute samples, and several interpretation examples. After the presentation, you may not know how to run machine learning algorithms, but you should be able to appreciate their value and avoid some of their limitations.

    Deborah Sacrey
    Owner, Auburn Energy

    Deborah is a geologist/geophysicist with 44 years of oil and gas exploration experience in Texas, Louisiana Gulf Coast and Mid-Continent areas of the US. She received her degree in Geology from the University of Oklahoma in 1976 and immediately started working for Gulf Oil in their Oklahoma City offices.

    She started her own company, Auburn Energy, in 1990 and built her first geophysical workstation using Kingdom software in 1996. She helped SMT/IHS for 18 years in developing and testing the Kingdom Software. She specializes in 2D and 3D interpretation for clients in the US and internationally. For the past nine years she has been part of a team to study and bring the power of multi-attribute neural analysis of seismic data to the geoscience public, guided by Dr. Tom Smith, founder of SMT. She has become an expert in the use of Paradise software and has seven discoveries for clients using multi-attribute neural analysis.

    Deborah has been very active in the geological community. She is past national President of SIPES (Society of Independent Professional Earth Scientists), past President of the Division of Professional Affairs of AAPG (American Association of Petroleum Geologists), Past Treasurer of AAPG and Past President of the Houston Geological Society. She is also Past President of the Gulf Coast Association of Geological Societies and just ended a term as one of the GCAGS representatives on the AAPG Advisory Council. Deborah is also a DPA Certified Petroleum Geologist #4014 and DPA Certified Petroleum Geophysicist #2. She belongs to AAPG, SIPES, Houston Geological Society, South Texas Geological Society and the Oklahoma City Geological Society (OCGS).

    Mike Dunn
    Senior Vice President Business Development

    Michael A. Dunn is an exploration executive with extensive global experience including the Gulf of Mexico, Central America, Australia, China and North Africa. Mr. Dunn has a proven a track record of successfully executing exploration strategies built on a foundation of new and innovative technologies. Currently, Michael serves as Senior Vice President of Business Development for Geophysical Insights.

    He joined Shell in 1979 as an exploration geophysicist and party chief and held increasing levels or responsibility including Manager of Interpretation Research. In 1997, he participated in the launch of Geokinetics, which completed an IPO on the AMEX in 2007. His extensive experience with oil companies (Shell and Woodside) and the service sector (Geokinetics and Halliburton) has provided him with a unique perspective on technology and applications in oil and gas. Michael received a B.S. in Geology from Rutgers University and an M.S. in Geophysics from the University of Chicago.

    Hal GreenDirector, Marketing & Business Development - Geophysical Insights

    Hal H. Green is a marketing executive and entrepreneur in the energy industry with more than 25 years of experience in starting and managing technology companies. He holds a B.S. in Electrical Engineering from Texas A&M University and an MBA from the University of Houston. He has invested his career at the intersection of marketing and technology, with a focus on business strategy, marketing, and effective selling practices. Mr. Green has a diverse portfolio of experience in marketing technology to the hydrocarbon supply chain – from upstream exploration through downstream refining & petrochemical. Throughout his career, Mr. Green has been a proven thought-leader and entrepreneur, while supporting several tech start-ups.

    He started his career as a process engineer in the semiconductor manufacturing industry in Dallas, Texas and later launched an engineering consulting and systems integration business. Following the sale of that business in the late 80’s, he joined Setpoint in Houston, Texas where he eventually led that company’s Manufacturing Systems business. Aspen Technology acquired Setpoint in January 1996 and Mr. Green continued as Director of Business Development for the Information Management and Polymer Business Units.

    In 2004, Mr. Green founded Advertas, a full-service marketing and public relations firm serving clients in energy and technology. In 2010, Geophysical Insights retained Advertas as their marketing firm. Dr. Tom Smith, President/CEO of Geophysical Insights, soon appointed Mr. Green as Director of Marketing and Business Development for Geophysical Insights, in which capacity he still serves today.

    Hana Kabazi
    Product Manager

    Hana Kabazi joined Geophysical Insights in October of 201, and is now one of our Product Managers for Paradise. Mrs. Kabazi has over 7 years of oil and gas experience, including 5 years and Halliburton – Landmark. During her time at Landmark she held positions as a consultant to many E&P companies, technical advisor to the QA organization, and as product manager of Subsurface Mapping in DecsionSpace. Mrs. Kabazi has a B.S. in Geology from the University of Texas Austin, and an M.S. in Geology from the University of Houston.

    Dr. Carrie LaudonSenior Geophysical Consultant - Geophysical Insights

    Carolan (Carrie) Laudon holds a PhD in geophysics from the University of Minnesota and a BS in geology from the University of Wisconsin Eau Claire. She has been Senior Geophysical Consultant with Geophysical Insights since 2017 working with Paradise®, their machine learning platform. Prior roles include Vice President of Consulting Services and Microseismic Technology for Global Geophysical Services and 17 years with Schlumberger in technical, management and sales, starting in Alaska and including Aberdeen, Scotland, Houston, TX, Denver, CO and Reading, England. She spent five years early in her career with ARCO Alaska as a seismic interpreter for the Central North Slope exploration team.