Table of contents
Summary
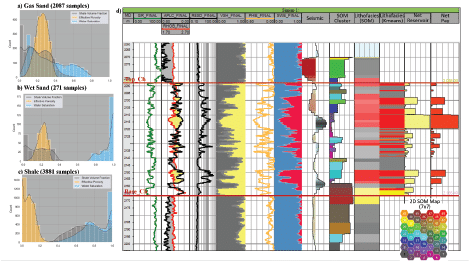
Identifying lithofacies is crucial for successful reservoir management decisions, offering vital insights into the reservoir distribution, quality, and aids in understanding hydrocarbon behavior within reservoirs. Petrophysicists usually study well data (e.g., wireline logs and cores) to understand reservoir properties and identify the reservoir lithofacies. However, extracting the lithofacies away from the well control is challenging especially for fields with limited well control. Seismic attributes aid in identifying the reservoir architecture and distribution. On the other hand, interpreting numerous seismic attribute volumes is a tedious and time-consuming process especially for large fields. To tackle these challenges, we developed a novel approach that employs unsupervised machine learning algorithms to identify lithofacies within the study reservoir.
In this study, a 3D seismic data acquired in Simian Field, Offshore Nile Delta has been used to generate typical instantaneous seismic attributes which are sensitive to changes in the reservoir properties. The reservoir properties of Simian channel complex have been studied by using conventional petrophysical analysis of seven wells. Two unsupervised machine learning clustering algorithms KMeans and Self-organizing Maps (SOM) were used in this study to improve our analysis of seismic and well data. KMeans clustering algorithm divides petrophysical data into distinct clusters (i.e., lithofacies) based on their attributes, minimizing the variance within every lithofacies cluster (Ali and Sheng-Chang, 2020). Figures (1a, b, and c) show Kernel density estimate (KDE) for each lithofacies’ of the seven wells used in this study. This lithofacies log was visually compared to the discrete net reservoir and net pay logs that were generated from the conventional petrophysical analysis of Simian Channel Complex. These comparisons are favorably observed in Figure 1d.
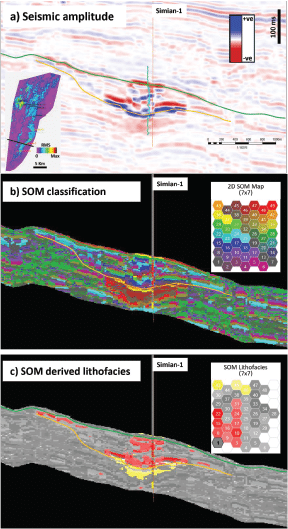
SOM is an effective unsupervised clustering and pattern recognition machine learning algorithm. It is capable of mapping multidimensional seismic attributes into two-dimensional grid while preserving topological relationships, allowing us to identify natural clusters within the seismic data that corresponds to different lithofacies and/or rock types (Kohonen, 2001; Smith and Treitel, 2011; Hussein et al., 2021). In the present study, SOM is used to integrate the reservoir information within the seismic amplitude in addition to six selected attribute volumes into one classification volume. SOM clustering volume shows more detailed geologic features compared to the original amplitude volume (Figures 2a and 2b). SOM clusters show a good correlation to the predicted lithofacies at the well location (Figures 1 and 2). The SOM classification neurons and the predicted lithofacies from the well logs are cross-tabulated to obtain the most probable lithofacies for each neuron with its associated probability. The predicted lithofacies are represented graphically by replacing the colors in the SOM topology map by those of the most probable lithofacies and their probabilities as illustrated in Figure 2c. This methodology allows us to develop a lithostratigraphic model of the subsurface that accurately delineates the different lithofacies within each seismic sample in both vertical and horizontal directions. It also aids in identifying gas-water contact across the whole field (Figure 2c). Cramer’s V and the percent Fit metric (ratio of intersection of lithofacies from well and SOM to total number of samples) are used to assess statistical robustness and accuracy of the predicted lithofacies. The computed Cramer’s V is 0.46 that suggests a relatively strong association between the lithofacies from SOM and those lithofacies predicted from the well logs. The accuracy of predicting gas sand lithofacies, measured by the percent Fit 0.69. This % Fit value suggests that the model predictions are reasonably accurate, with moderate overlap between the predicted and actual lithofacies which indicates that the model is performing well.
Kohonen, T. (2001). Self-Organizing Maps. Springer Series in Information Sciences. DOI: 10.1007/978-3-642-56927-2
Smith, T., & Treitel, S. (2011). Introduction to Self-Organizing Maps in multi-attribute seismic data. Geophysical Society of Houston
Hussein, M., R. R. Stewart, D. Sacrey, J. Wu, and R. Athale (2021). Unsupervised machine learning using 3D seismic data applied to reservoir evaluation and rock type identification: Interpretation, 9, no. 2, T549–T568 Doi: 10.1190/int-2020-0108.1.
Ali, A. and Sheng-Chang, C. (2020). Characterization of well logs using K-mean cluster analysis: Journal of Petroleum Exploration and Production Technology, 10, 2245–2256 Doi: 10.1007/s13202-020-00895-4


