Summary
Accurately predicting lithofacies and detecting faults in thin, compartmentalized gas reservoirs is challenging due to complex stratigraphy and limited data resolution. This study addresses these challenges in an Offshore area in Eastern India, where one well intersects thin Pleistocene gas sands. Traditional lithofacies prediction methods, such as seismic inversion, are often constrained by the quality and extent of data. We applied K-means clustering to well log data and used Self-Organizing Maps (SOM) on multi-attribute seismic volumes to develop a high-resolution lithofacies model. This process produced a 95% match between lithofacies from logs and lithofacies from seismic. Convolutional Neural Networks (CNN) further refined fault detection, enhancing the structural understanding of reservoir compartments. Integrating these AI-driven methods resulted in a unified model of lithofacies and faults, significantly improving reservoir characterization. This approach offers an efficient alternative to conventional methods, aiding connectivity assessment and informing exploration strategies in complex geological settings.
Introduction
Lithofacies prediction and fault detection in thin, highly compartmentalized gas reservoirs pose significant technical and geological challenges. Complex stratigraphic and structural features hinder hydrocarbon flow and complicate connectivity assessment across reservoir blocks. In this study area, there is only one well intersecting a few thin, gas-bearing Pleistocene sandstones. The limited quantity and variable quality of well data often constrain robust characterization, while the seismic data’s insufficient vertical resolution further challenges the detection of thin reservoirs. Traditional lithofacies prediction relies on rock physics, expected geological trends, and techniques like amplitude versus offset (AVO) analysis and seismic inversion (Avseth et al., 2005; Mavko and Mukerji, 2009; Dvorkin and Nur, 1996). These approaches, though powerful, require extensive expertise, high-quality data, and are often costly, especially in heterogeneous, low-resolution areas (Russell and Hampson, 1991; Veeken and Silva, 2004). In this context, artificial intelligence (AI) offers a promising alternative. Neural networks and classification algorithms, like SOM, are powerful nonlinear cluster analysis and pattern recognition techniques that help geoscientists identify patterns that can be related to lithofacies (Chaveste et al., 2023).
In this study, AI predicts lithofacies volumes by combining K-means clustering of well log data with multi-attribute seismic classification volumes sampled at a 4-millisecond interval. This approach can match or exceed traditional inversion methods in accuracy, with less human intervention and greater tolerance for incomplete data. Additionally, convolutional neural networks (CNN) were employed to generate fault classification and probability volumes (Wu et al., 2019), which, alongside lithofacies volumes, help unravel the area’s complex stratigraphic and structural framework, essential for constructing static and dynamic reservoir models.
Geologic Setting
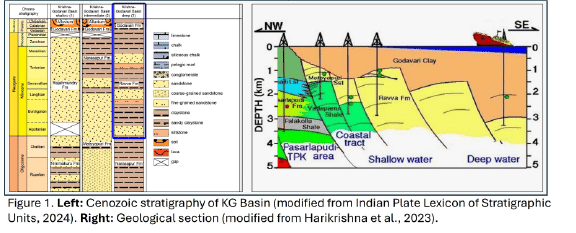
This study is in a peri-cratonic passive margin basin off the east coast of India (Gupta, 2006). The basin has a layered tectono-sedimentary history shaped by rifting and sedimentation, with two major ectonic phases. This study focuses on the Rajahmundri Sandstone and Ravva Formation. The Ravva is glauconitic and calcareous, while the Rajahmundri is medium-grained and lateritized. Pleistocene-Miocene sedimentation created a complex structure with growth faults, intraslope lobes, and bypass channels (Figure 1).
Methodology
Machine Learning (K-means) for Lithofacies Log Generation
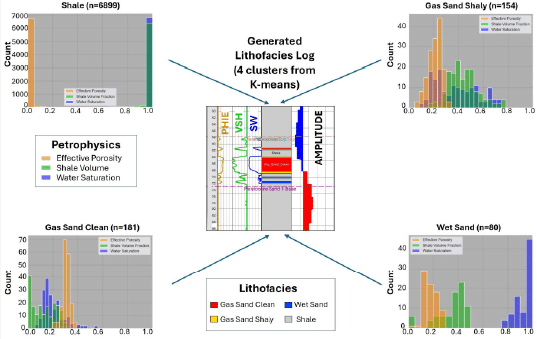
K-means clustering is highly valued in petroleum engineering for classifying well log data due to its efficiency with large datasets common in reservoir analysis. Its straightforward iterative approach enables rapid processing of data across various reservoir scales (Han et al., 2011). When applied to high-dimensional well log data, such as porosity, resistivity, and permeability, K-means effectively uncovers patterns within these various data types to identify lithofacies and assess reservoir quality ( Jain et al., 2010). A significant advantage of K-means is its interpretability; each cluster centroid represents the average properties of a lithofacies, aiding geoscientists in evaluating reservoir characteristics. Compared to more complex algorithms like SVMs or Neural Networks, K-means produces clusters that are easier to interpret, which is valuable for initial exploratory analysis when labeled data may be unavailable or costly (Chen et al., 2018). Additionally, K-means is highly scalable, processing data across numerous wells effectively. By selecting an optimal number of clusters (K), the approach can adapt to specific geological needs for a more comprehensive reservoir characterization. In this study, clustering used Effective Porosity, Volume of Shale, and Water Saturation as input properties. Initially, eight clusters were established, and histograms of each petrophysical curve response helped define four lithofacies: Gas Sand Clean, Gas Sand Shaly, Shale, and Wet Sand.
Machine Learning (Self-Organizing Maps) for Multi-Attribute Volume Generation
The seismic data used in this study originates from a Pre-Stack Time Migration amplitude volume, with a 4-millisecond sample interval and 12.5 meters squared bin size. This amplitude volume served as the base for generating eleven instantaneous seismic attributes: Phase Acceleration, Attenuation, Bandwidth, Envelope, Envelope Slope, Envelope Second Derivative, Hilbert, Instantaneous Frequency, Relative Acoustic Impedance, Sweetness, and Thin Bed. These attributes were classified simultaneously through the Self-Organizing Maps (SOM) neural network (Kohonen, 1982). Smith and Treitel (2015) stated that Self-organizing maps at single sampling interval are a practical way to identify natural clusters in multi-attribute seismic data. Here, the SOM volume was transformed into a log along the well path, allowing direct statistical comparison with the K-means lithofacies log, allowing the geoscientists to link both types of data through the Lithofacies Prediction tool in Paradise®.
Fault Detection Using Deep Learning
The Convolutional Neural Network (CNN) was trained using thousands of synthetic volumes with variations in the characteristics of reflectors (density, noise, dominant frequency, vertical shearing variation, dipping beds) and faults (dip, azimuth, location, displacements, attenuation, among others), allowing the algorithm to detect even the most ‘imperceptible’ faults to the naked eye (Qi et al, 2022).
The workflow starts with a pre-conditioning step of the original seismic amplitude, using a Structure Oriented Filter (SOF3D) that involves the computation of Dip, Similarity and SOF3D volumes for suppressing noise. The CNN will perform the “computer vision” task of comparing the training data with the real filtered data and producing a set of fault attributes that include Fault Probability and Fault
Classification. The next step is the post-processing of the fault images; creating more continuous features for faults (fault enhancement) and then sharpening them in the skeletonization process (Qi et al, 2020).
Results
In this study, we combined three key methodologies: K-means clustering for lithofacies classification from well logs, Self-Organizing Maps (SOM) for seismic multiattribute classification at 4 milliseconds scale, and seismic fault detection using Convolutional Neural Networks (CNN) to build a high-resolution reservoir model. We first applied K-means clustering to well log data, generating a lithofacies log based on effective porosity, water saturation, and shale volume. Four distinct clusters or lithofacies were identified in the histograms, reflecting their respective data distributions: Shale, Clean Gas
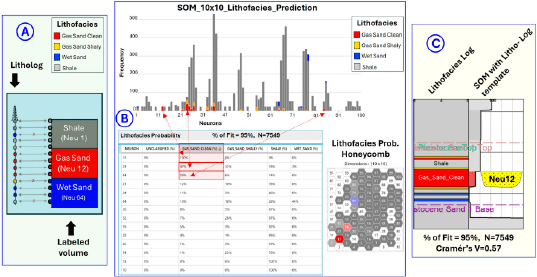
Sand, Shaly Gas Sand, and Wet (Brine) Sand (Figure 2, corners). These clusters were subsequently used to create a lithofacies log for the well, where the most significant sandstone layer encountered measures only 5 meters in thickness (Figure 2, center). As illustrated in Figure 3, the lithofacies log provided the basis for extending facies classification across the seismic SOM volume. The sampling interval scale-based SOM multiattribute seismic analysis enabled resolving the sandstone mentioned above. Each one of the SOM voxels (neurons) extracted along the well path was analyzed according to its lithofacies log, determining in a quantitively manner through contingency tables the probability of each neuron representing a specific lithofacies. With a total of 7549 samples evaluated, the percentage of fit between the lithofacies log and the predicted lithofacies volume is 95%. After grouping similar neurons in the contingency table, several parameters were computed to obtain Cramér’s V equal to 0.57, with a predefined Type I error equal to 0.05, the Chi-square statistic of 2486.26, three degrees of freedom, p-value of 0 and Statistical Power of 0.96. All these statistical parameters provide evidence of a strong
association between the seismic lithofacies prediction (LP) classification volume and the lithofacies log.
Discussion and Conclusions
The integration of lithofacies log classification, seismic multi-attribute analysis, and fault detection has significantly refined our understanding of the Rajahmundri Sandstone and Ravva Formation within the basin. By combining K-means clustering on well log data with Self-Organizing Maps (SOM) on seismic attributes, we created a highresolution lithofacies model that aligns well with the depositional complexity and structural heterogeneity of the basin.
K-means clustering allowed us to define lithofacies based on porosity, shale volume, and water saturation, providing a direct, interpretable lithofacies log to guide reservoir characterization. This approach is particularly valuable given the stratigraphic unit thin sandstone layers. Importantly, the powerful SOM’s sampling interval multiattribute classification extended lithofacies beyond the well, capturing seismic responses of each lithofacies at a fine spatial scale. This integration is crucial in complex environments where conventional seismic alone might not sufficiently differentiate between lithofacies.
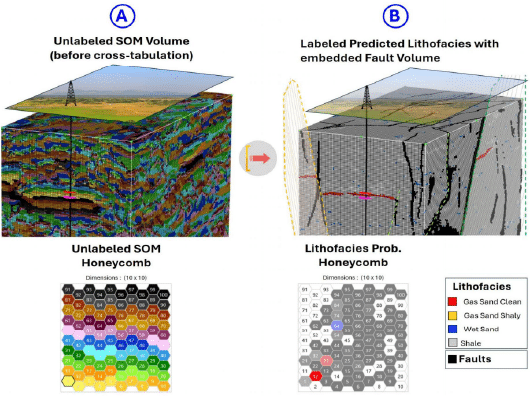
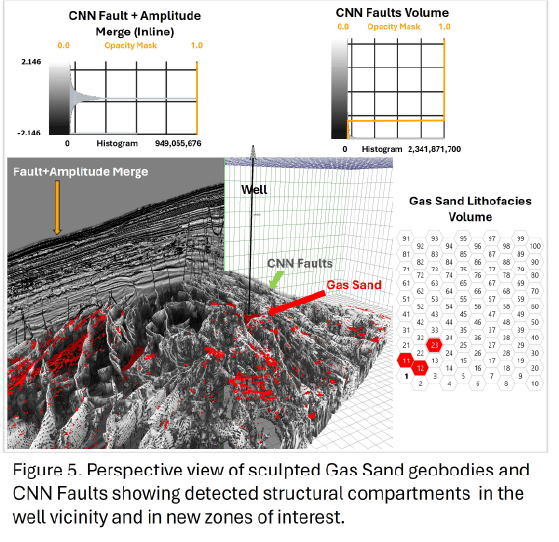
The fault detection using CNN-based seismic analysis added another layer of precision, defining structural compartments and enhancing the lithofacies model’s accuracy. Fault planes, mapped directly into the Gas Sand and Shale lithofacies volumes, revealed structural entrapment mechanisms essential for understanding reservoir connectivity. This integrated approach not only refines the interpretation of reservoir architecture but also streamlines the interpreter’s workflow by bringing together essential elements in a unified model, allowing for a comprehensive view of lithofacies distribution and structural compartmentalization.
By incorporating faults within lithofacies distributions, the model provides a robust framework for geologic continuity and compartmentalization, aligning with observed growth fault systems and toe-thrusts from previous basin studies. This combined approach ultimately delivers a more accurate reservoir model that can drive future exploration and development strategies in the basin by addressing both stratigraphic and structural elements in an integrated, data-driven manner.
References
Avseth et al., 2005; Mavko and Mukerji, 2009; Dvorkin and Nur, 1996.Russell and Hampson, 1991; Veeken and Silva,
2004
Russell and Hampson, 1991; Veeken and Silva, 2004.
Chaveste et al., 2023.
Wu et al., 2019).
Gupta, 2006.
Han et al., 2011.
Jain et al., 2010.
Chen et al., 2018.
Kohonen, 1982.
Qi et al, 2020.


